4: Configuration Using the Web Manager
EDS4100 4 Port Device Server User Guide 115
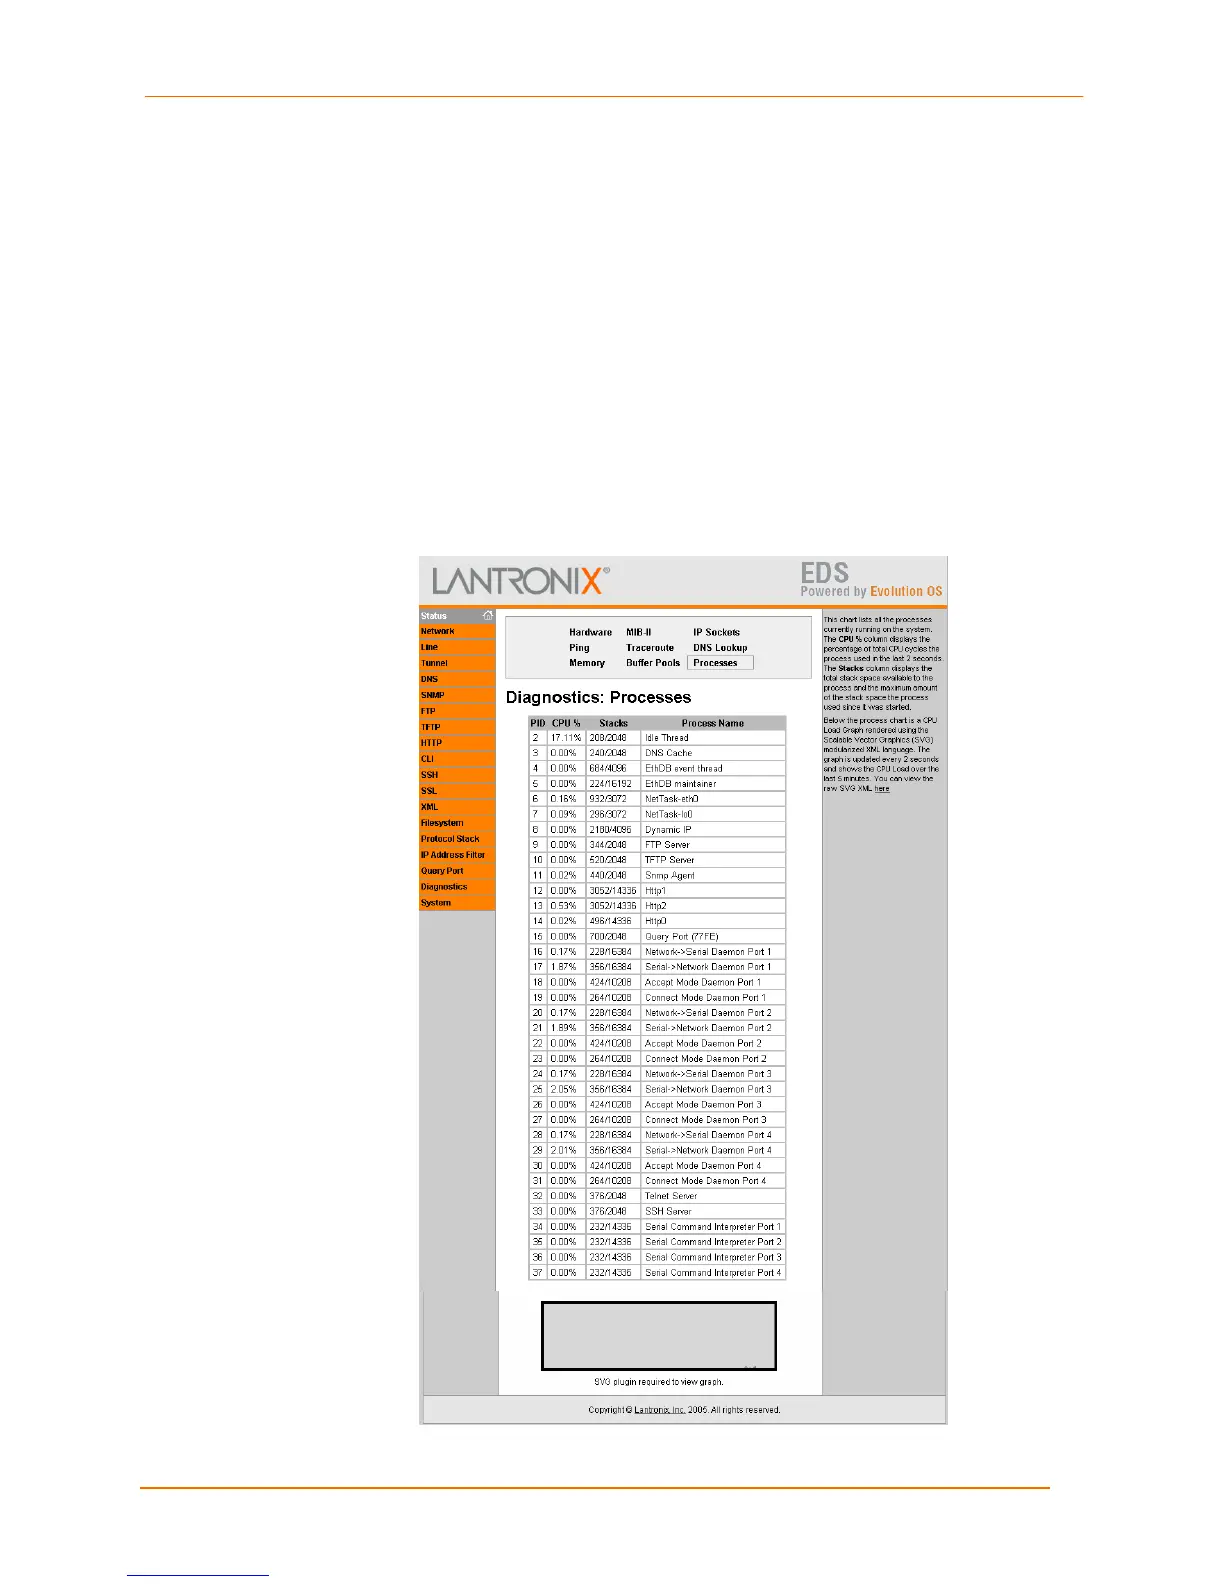
Diagnostics: Processes Page
Clicking Processes from one of the diagnostics page displays a read-only screen that
lists all processes running on the EDS4100.
The CPU % column displays the percentage of total CPU cycles a process used in
the last two seconds.
The Stacks column displays the total stack space available to the process and the
maximum amount of the stack space the process used since it was started.
Below the process chart is a CPU Load Graph that shows the CPU load over the last five
minutes. The graph is rendered using the Scalable Vector Graphics (SVG) modularized
XML language and updates every two seconds. The information area contains a link for
viewing the raw SVG XML.
Figure 4-51. Diagnostics: Processes Page
 Loading...