Measurement and Analysis
Vivid S5/Vivid S6 User Manual 267
R2424458-100 Rev. 2
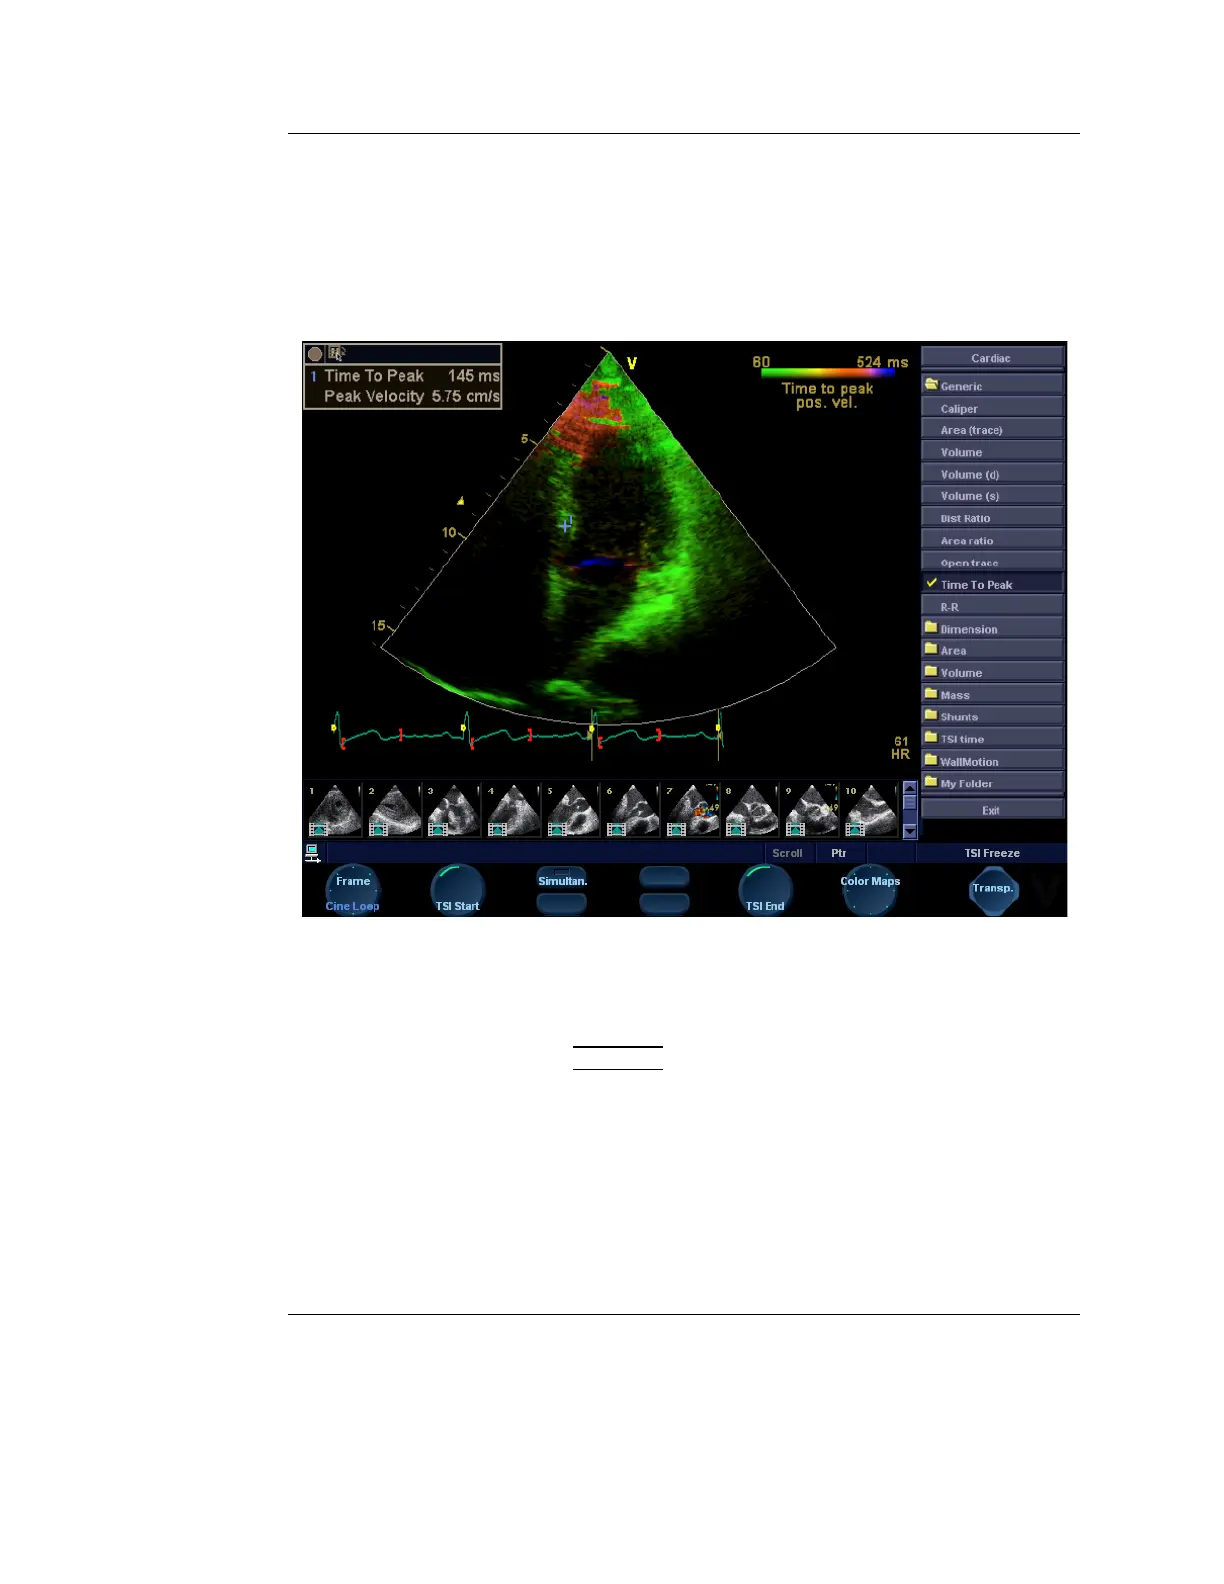
4. Place a point in the middle of a basal or mid-level
myocardial segment in the TSI image.
5. The Time to peak value for the segment is displayed in the
Measurement result window.
Note: to judge the quality of your data at the measuring
point in the 2D image see the Caution text on page 272.
Figure 7-6: TSI Generic Time to peak measurement screen
Segment Time to peak measurements
1. Acquire TSI loops from all three apical views.
2. Press
MEASURE and select TSI time study.
The TSI loop freezes at the TSI end frame.
The first measurement in the study is automatically
selected (see Figure 7-7).
3. Place a point in the middle of the corresponding segment in
the TSI image.
The Time to peak and the Peak velocity for the segment
are displayed in the Measurement result window.

 Loading...