Quantitative Analysis
Vivid S5/Vivid S6 User Manual 395
R2424458-100 Rev. 2
Vertical units
Applicable with
contrast data only.
When analyzing contrast data, the Y-axis can be set to display
either logarithmic scale (dB) or linear, acoustical units (AU) for
both tissue intensity (2D) or Angio intensity data.
Selecting the Y-axis unit
1. If necessary, press
TRACKBALL until the QA trackball
assignment is selected.
2. Trackball to the Analysis window.
3. Press
UPDATE MENU in the trackball area on the control
panel.
The System menu is displayed.
4. Trackball to Vertical unit.
5. Press
SET.
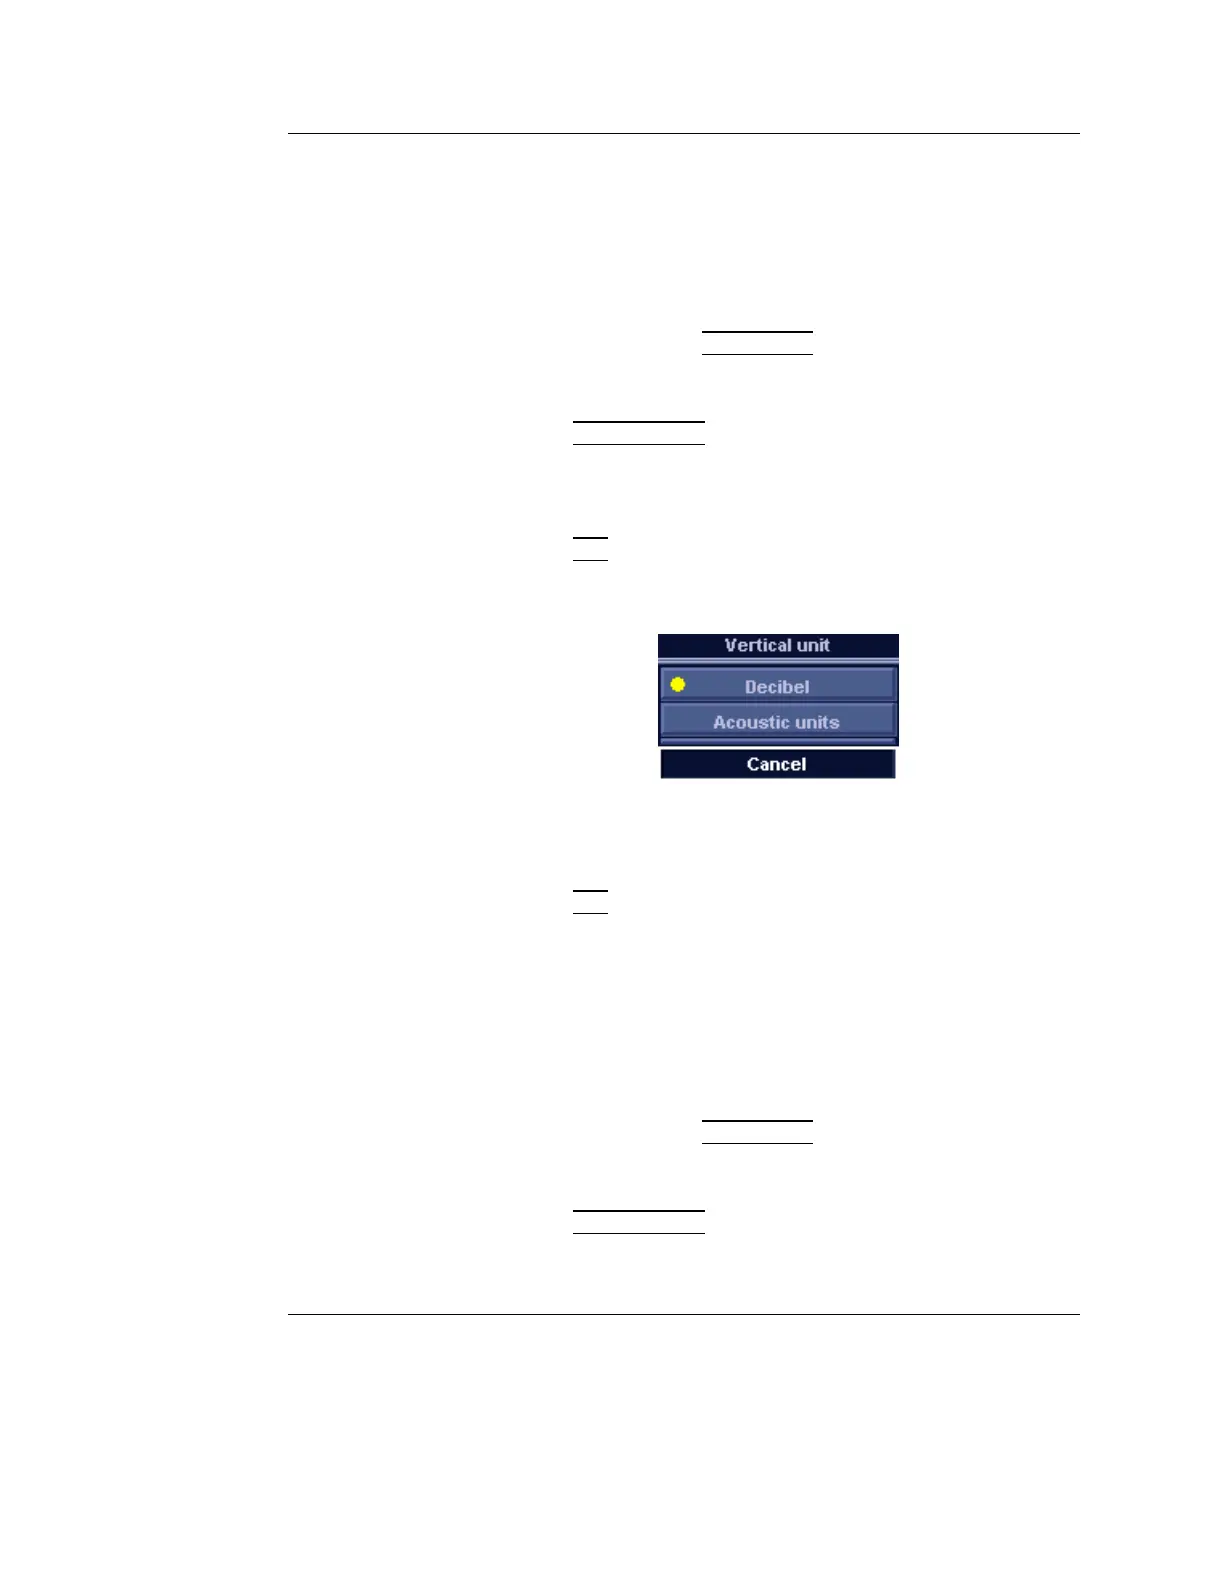
The Vertical unit menu is displayed.
Figure 8-6: The Vertical unit menu
6. Trackball to the desired option.
7. Press
SET.
Trace smoothing
The system can smooth the traces displayed by applying a filter
over a defined time window. The type of filter available is
depending on the analysis signal displayed.
Smoothing trace(s)
1. If necessary, press TRACKBALL until the QA trackball
assignment is selected.
2. Trackball to the Analysis window.
3. Press
UPDATE MENU in the trackball area on the control
panel.
The System menu is displayed.

 Loading...