Start-up 107
Parameters tool
The Parameters tool can be used to view or change most of the drive's parameters.
1. Click the Parameters icon in the Toolbox on the left of the screen. The main area
o
f the Mint WorkBench window displays the Parameters editor screen.
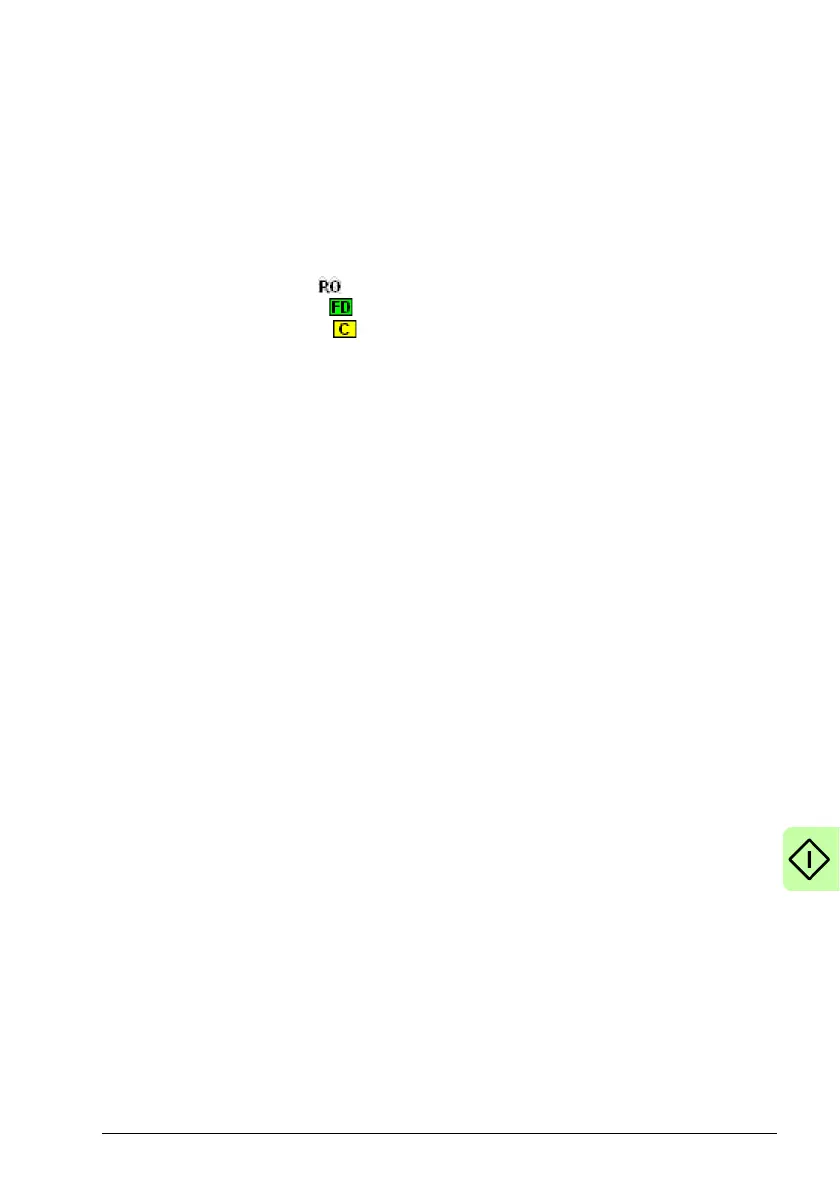
Items listed with a grey
icon are read only so cannot be changed.
Items listed with a green
icon are currently set to their factory default value.
Items listed with a yellow icon have been changed from their factory default
value, either during the commissioni
ng process or by the user.
2. In the parameters tree, scroll to the required
item. Click on the small + sign beside
the item's name. The list expands to show all items in the category. Click on the
item you wish to edit.
3. The adjacent table lists the chosen item. Click in the Active Table cell and enter a
va
lue. This immediately sets the parameter, which remains in the MicroFlex e190
un
til another value is defined or power is removed. The icon to the left of the item
becomes yellow to indicate that the value has been changed. On the menu,
choose Tools, Store Drive Parameters to ensure the value remains after a power
cycle.
Many of the MicroFlex e190's parameters are set automatically by the
C
ommissioning Wizard, or when tests are performed in the Fine-tuning window.
Spy window
The Spy window can be used to monitor and capture parameters in real-time. If you
tried the test moves in Performing test moves - continuous jog on page 104 or
Performing test moves - rela
tive positional move on page 105 then you have already
seen the Spy window, as it is displayed in conjunction with Edit & Debug mode. See
the Mint help file for full details of each tab.
1. Click the Edit & Debug icon in the Toolbox on the left of the screen.
The Spy window is displayed on the right of the screen. Click on the tabs at the
b
ottom of the window to select the required function.
2. The Axis tab displays the five most commonl
y monitored parameters, together
with the state of special purpose inputs and outputs.
3. The I/O tab displays the state of all the digital inputs and outputs.
Click on an output LED to toggle the output on/off.
4. The Monitor tab allows up to six parameters to be selected for monitoring.
Click in a drop down box to select a parameter.
At the bottom of the Monitor tab, real
-time data capture can be configured.
 Loading...