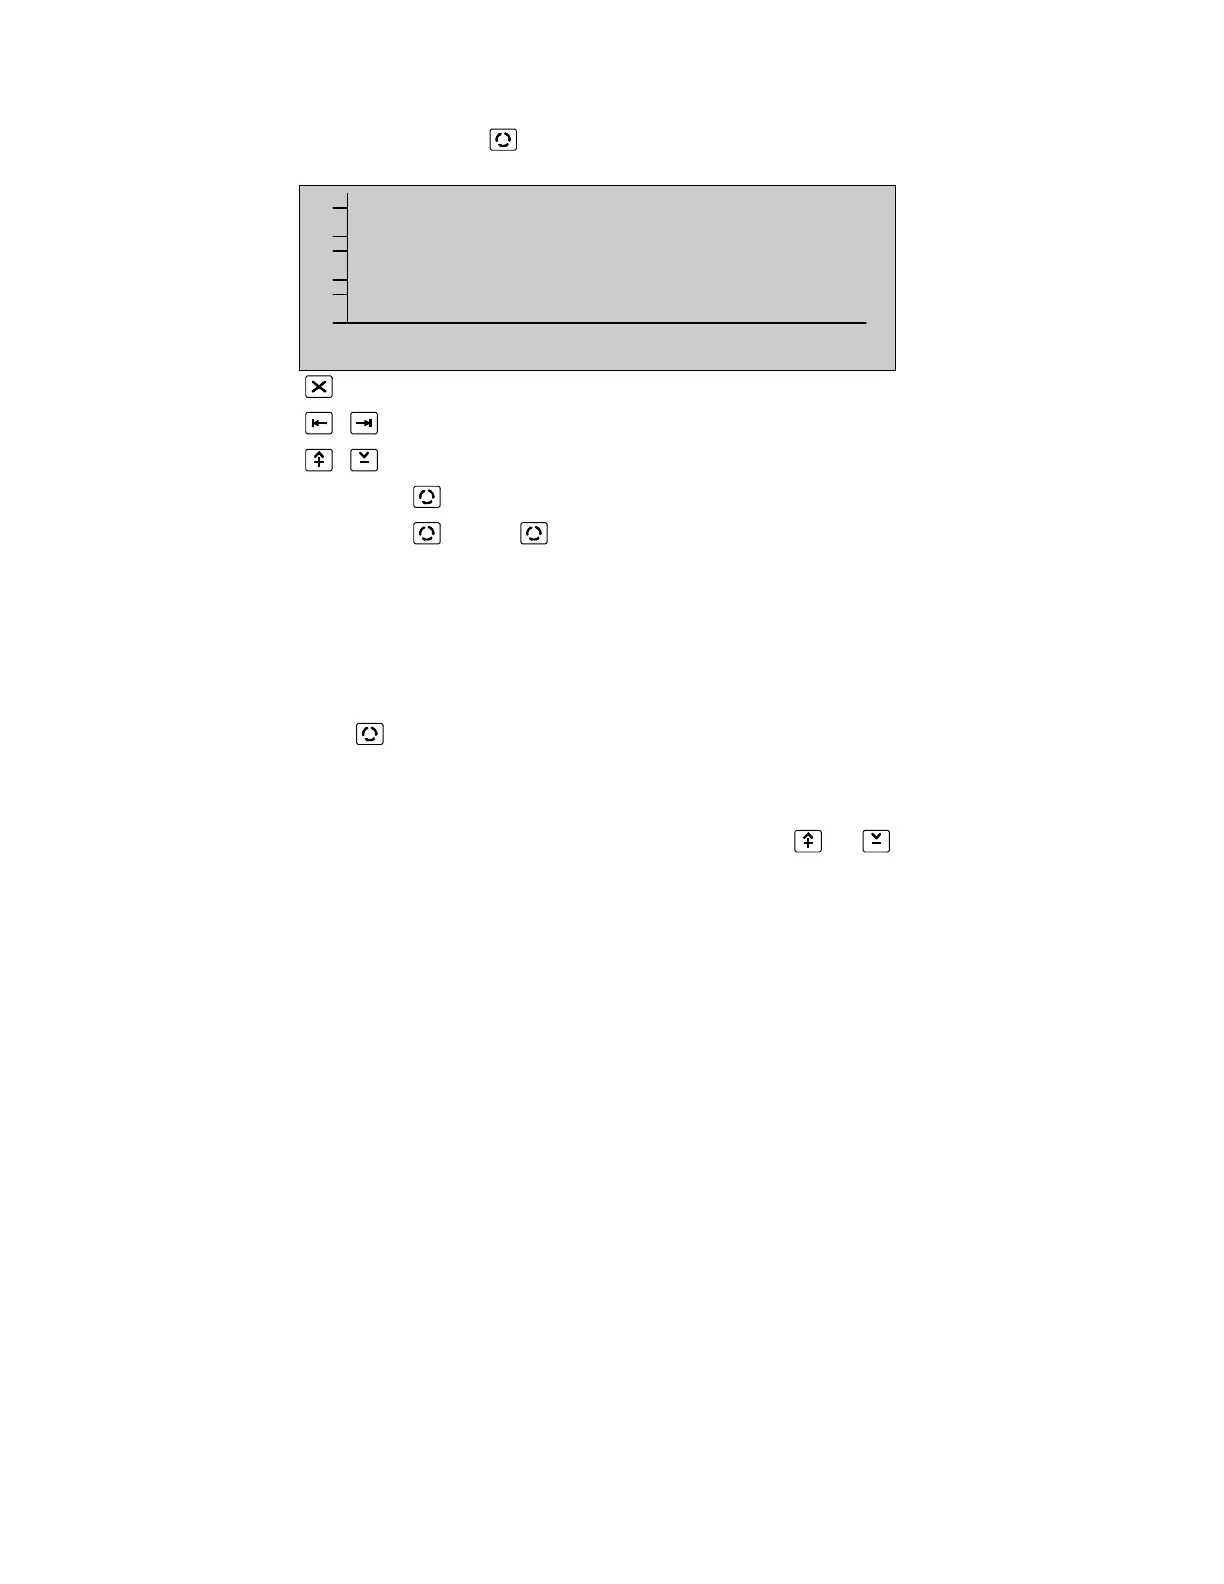
Zone graphic screen
(ZONE GRAPHICS, )
128
64
0
more ^V, <>, X
Alarms: 0 Faults: 0 Cond.: 0 P: 1 SDZ
Return to Device Menu Page 78
Select bar in bar graph
Select scale of bar graph
Press [More ] to view statistics of selected bar Page 103
Press [More ], [More ] to return to the Zone Graphics Screen Page 102
A bar graph of the smoke and heat detectors is displayed for the zone and parameter
selected. The bar graph is dynamically updated once per loop scan.
The statistics of a device can be viewed by selecting the bar of the device and pressing
[More ]. The selected bar is displayed with the bar "coloured in".
The scale of the graph for compensation and communication quality is fixed at 0-100%.
The scale for other values can be selected by pressing or :
0—128
0— 64
32— 64
 Loading...