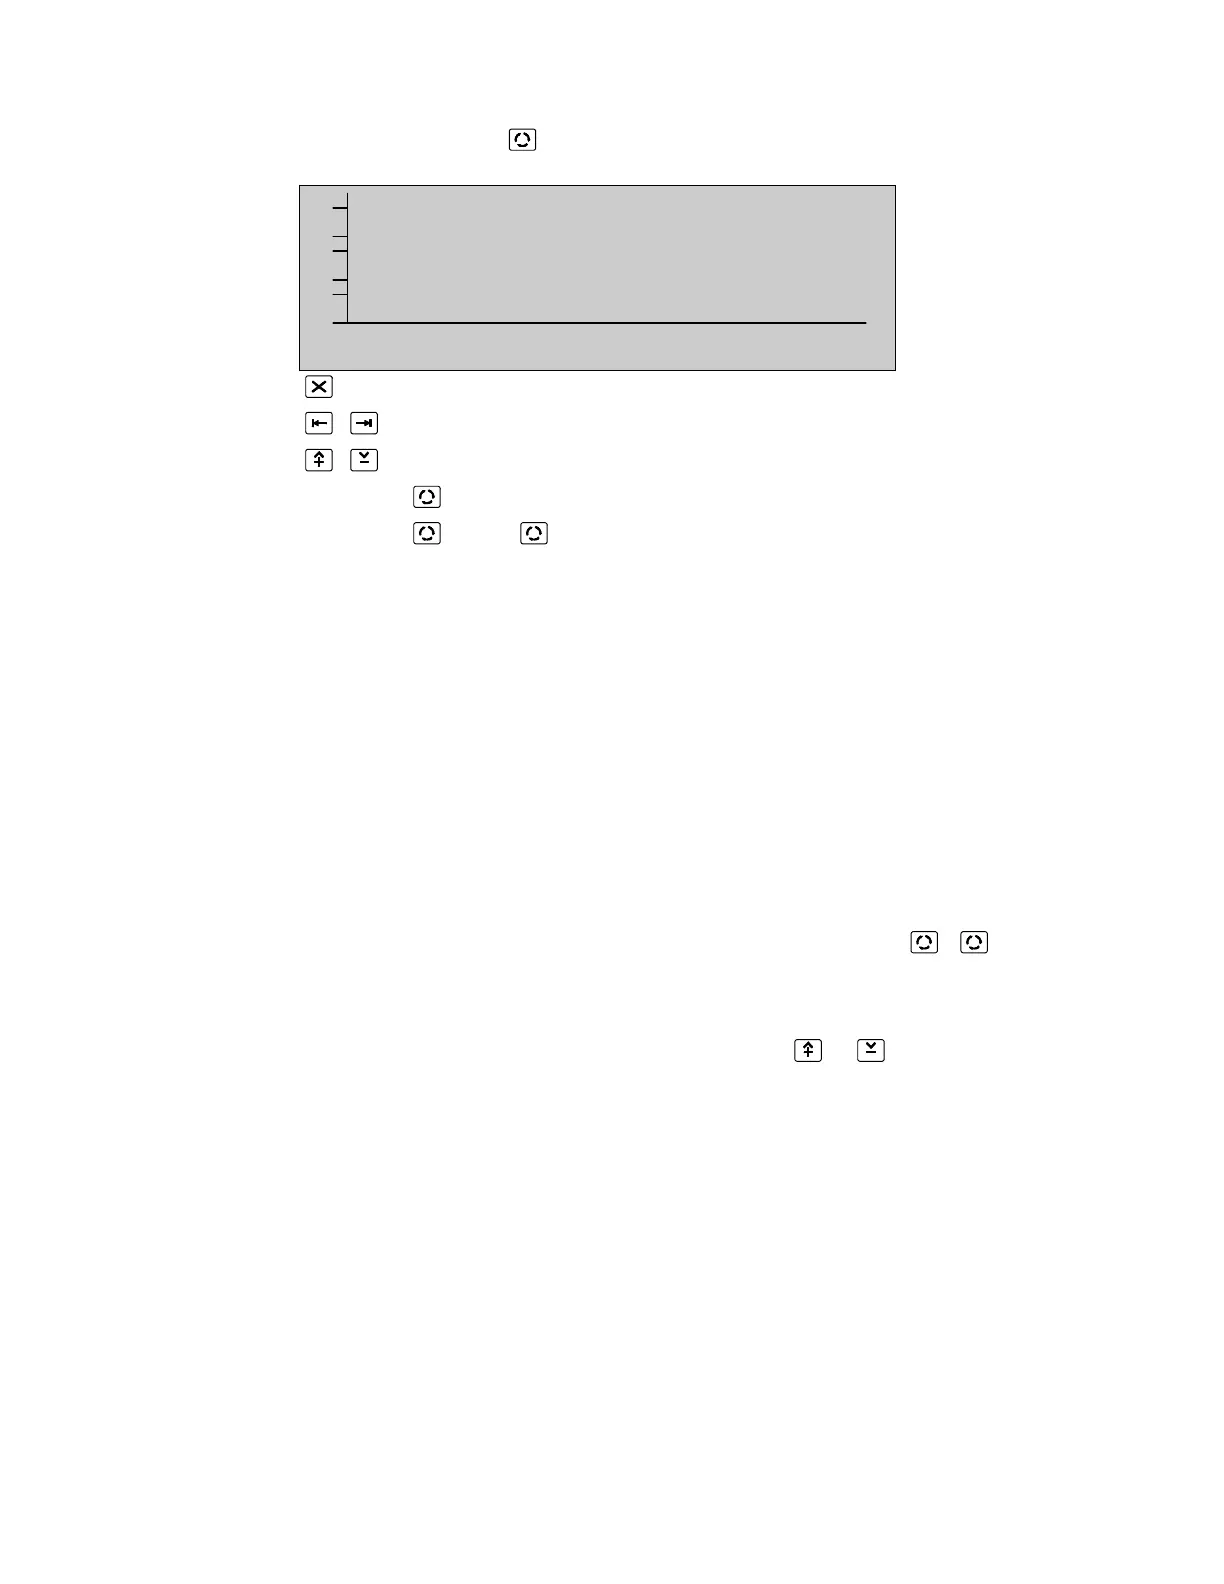
Device graphic screen
(DEVICE GRAPHICS, )
128
64
0
more ^V, <>, X
Alarms: 0 Faults: 0 Cond.: 0 P: 1 SDZ
Return to Device Menu Page 78
Select a time position in the graph
Select the scale of the graph
Press [More ] to view statistics of the selected device Page 103
Press [More ], [More ] to return to the Device Graphic Screen Page 106
A line graph of the selected device recording is displayed. (See Page 104).
The graph is drawn from left to right. Once the screen is full, the graph line is "rolled" from
right to left. Thus, the right most point of the graph represents the present time and each
point to the left is one sample time previous. The graph will display 217 time samples.
The time window for the various sample rates is thus:
1/10 second: 36 minutes
1/min: 3.6 hours
1/20 min: 72 hours
1/day: 217 days
A cursor is used to select a particular time in the graph. The device statistics at that time
is displayed on the Device Graphics Screen (Page 106) by pressing , .
The scale of the graph for compensation and communication quality is fixed at 0-100%.
The scale for other values can be selected by pressing or :
0—128
0— 64
32— 64
 Loading...