Version 7.2 811 Mediant 1000B Gateway & E-SBC
User's Manual 50. Viewing Performance Monitoring
50 Viewing Performance Monitoring
This section describes how to view performance monitoring in the device's Web interface.
50.1 Viewing Trunk Utilization
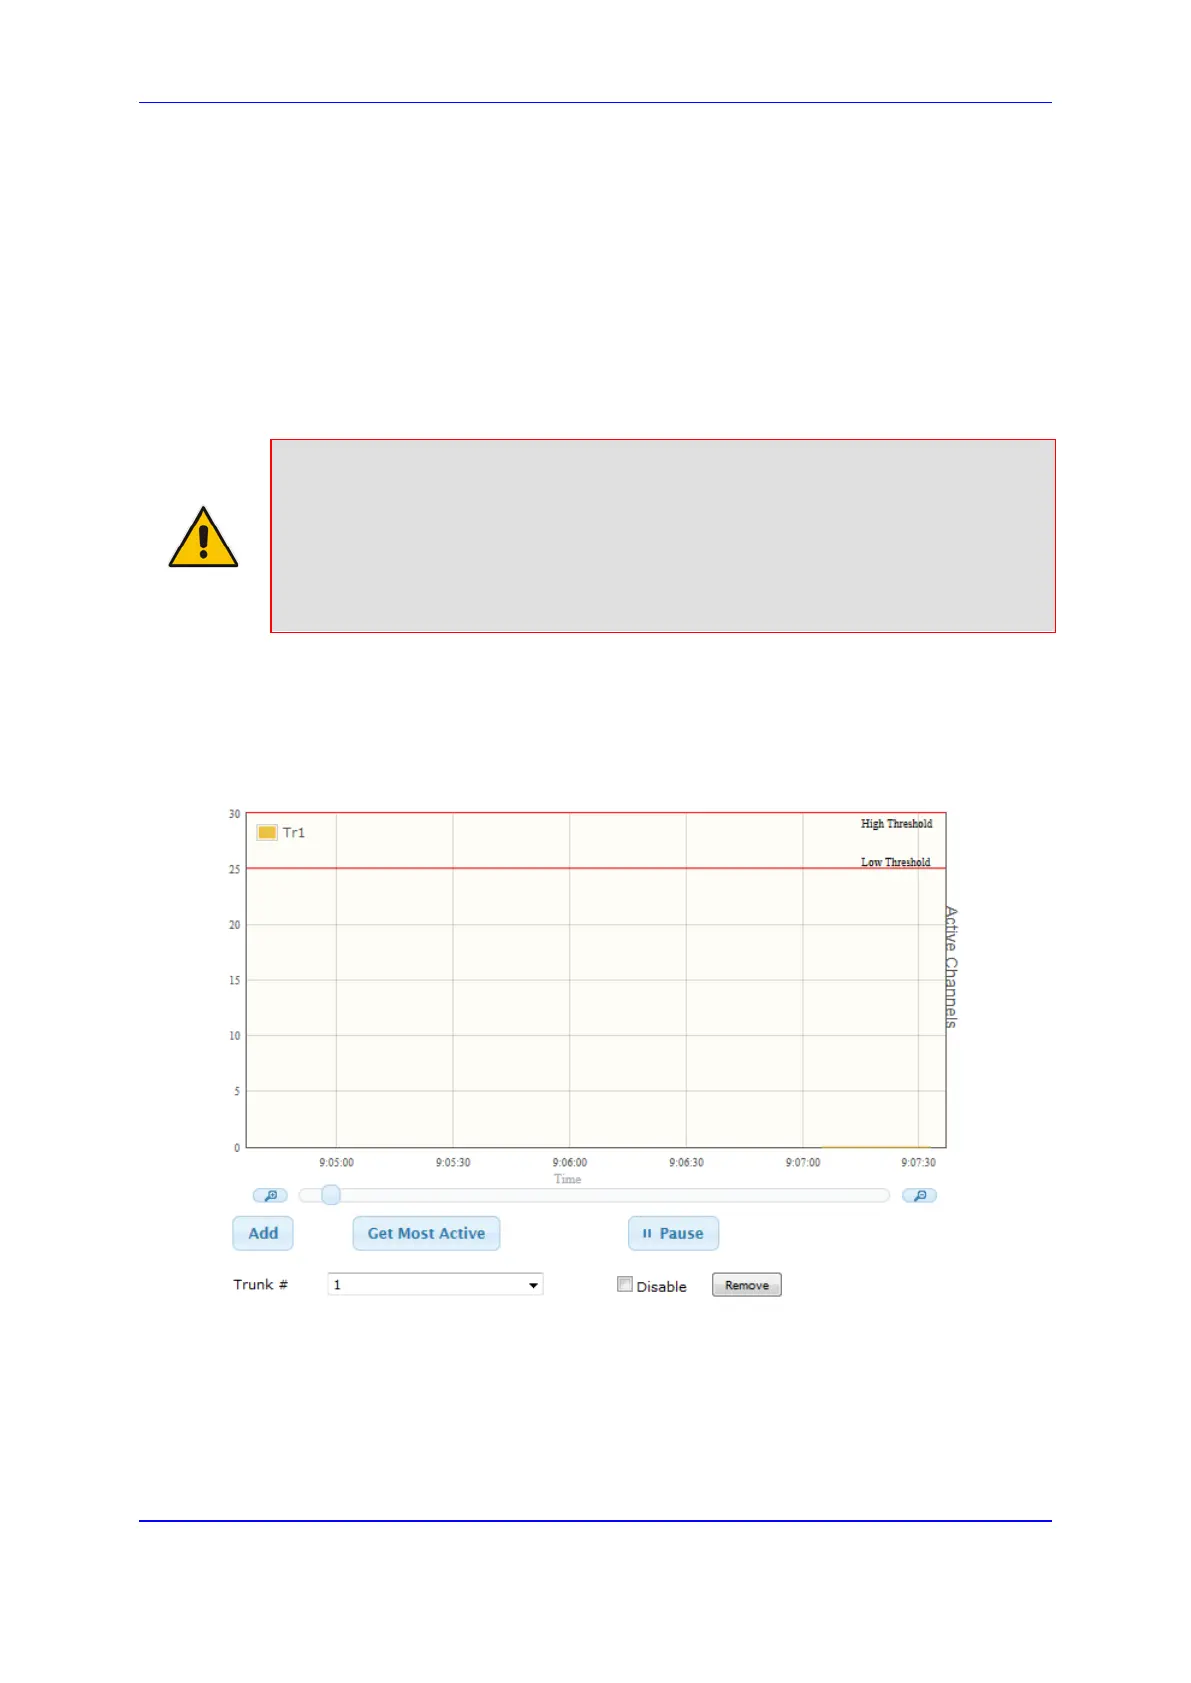
You can view the number of active channels per trunk over time in the Web interface's
Trunk Utilization page. The page displays a graph, where the x-axis indicates the time
(hh:mm:ss) and the y-axis the number of active trunk channels.
Note:
• The Trunk Utilization page is applicable only to the Gateway application.
• To view the graph, your device must be connected to and configured with trunks.
• To view the graph, you must first disable the SBC application.
• If you navigate to a different page, the data displayed on the graph and all its
settings are cleared.
To view the number of active trunk channels:
1. Open the Trunk Utilization page (Monitor menu > Monitor tab > Performance
Monitoring folder > Trunk Utilization).
Figure 50-1: Viewing Trunk Utilization
2. From the 'Trunk' drop-down list, select the trunk for which you want to view active
channels.
 Loading...


