Version 7.2 897 Mediant 1000B Gateway & E-SBC
User's Manual 55. Syslog and Debug Recording
device to generate debug recording packets for specific calls, using Logging Filter rules in
the Logging Filters table (see ''Configuring Log Filter Rules'' on page 881).
To configure the debug recording server's address:
1. Open the Logging Settings page (Troubleshoot tab > Troubleshoot menu >
Logging folder > Logging Settings).
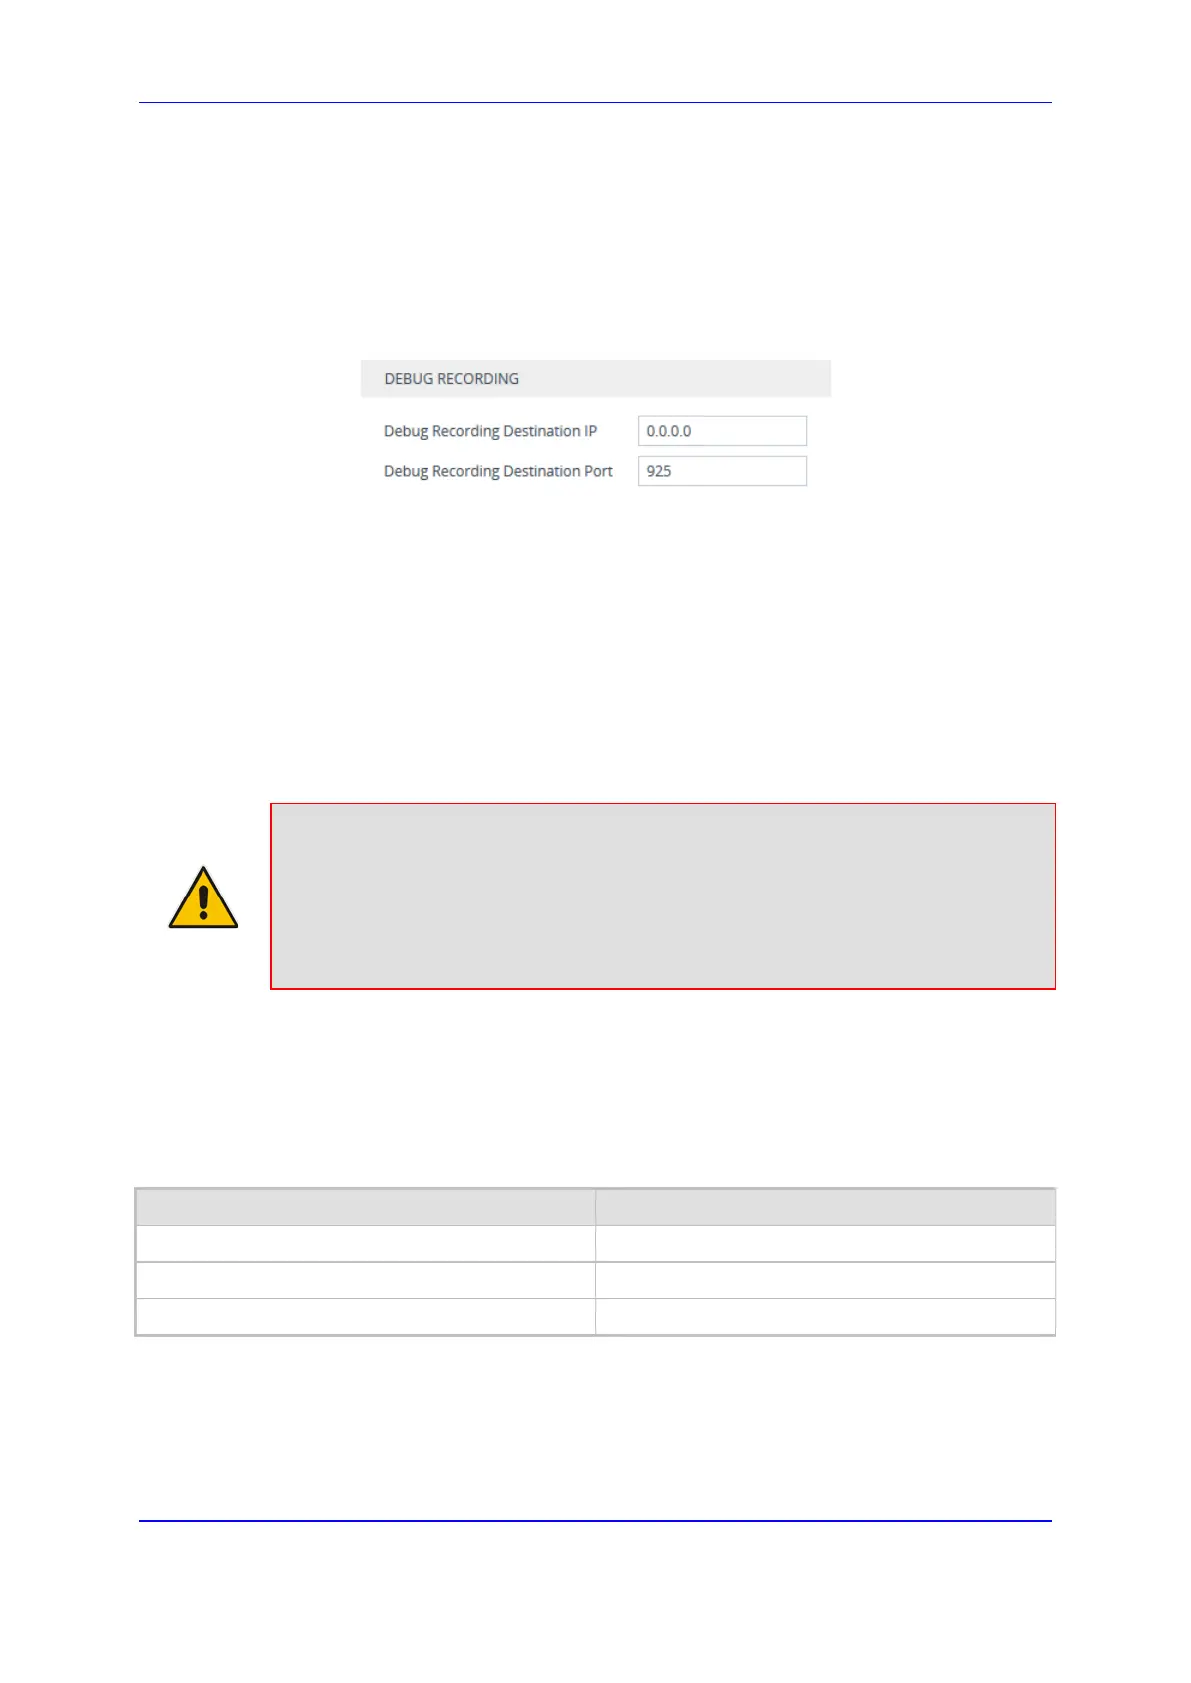
Figure 55-7: Configuring Debug Recording Server
2. In the 'Debug Recording Destination IP' field, configure the IP address of the debug
capturing server.
3. In the 'Debug Recording Destination Port' field, configure the port of the debug
capturing server.
4. Click Apply.
55.3.2 Collecting Debug Recording Messages
To collect debug recording packets, use the open source packet capturing program,
Wireshark. AudioCodes proprietary plug-in files for Wireshark are required.
Note:
• The default debug recording port is 925. You can change the port in Wireshark
(Edit menu > Preferences > Protocols > AC DR).
• The plug-in files are per major software release of Wireshark. For more
information, contact your AudioCodes sales representative.
• The plug-in files are applicable only to Wireshark 32-bit for Windows.
To install Wireshark and the plug-ins for debug recording:
1. Install Wireshark on your computer. The Wireshark program can be downloaded from
http://www.wireshark.org.
2. Download the proprietary plug-in files from www.audiocodes.com/downloads.
3. Copy the plug-in files to the directory in which you installed Wireshark, as follows:
Copy this file To this folder on your PC
...\dtds\cdr.dtd Wireshark\dtds\
...\plugins\<Wireshark ver.>\*.dll Wireshark\plugins\<Wireshark ver.>
...\tpncp\tpncp.dat Wireshark\tpncp
4. Start Wireshark.
5. In the Filter field, type "acdr" (see the figure below) to view the debug recording
messages. Note that the source IP address of the messages is always the OAMP IP
address of the device.

 Loading...