101
The effect of TRng
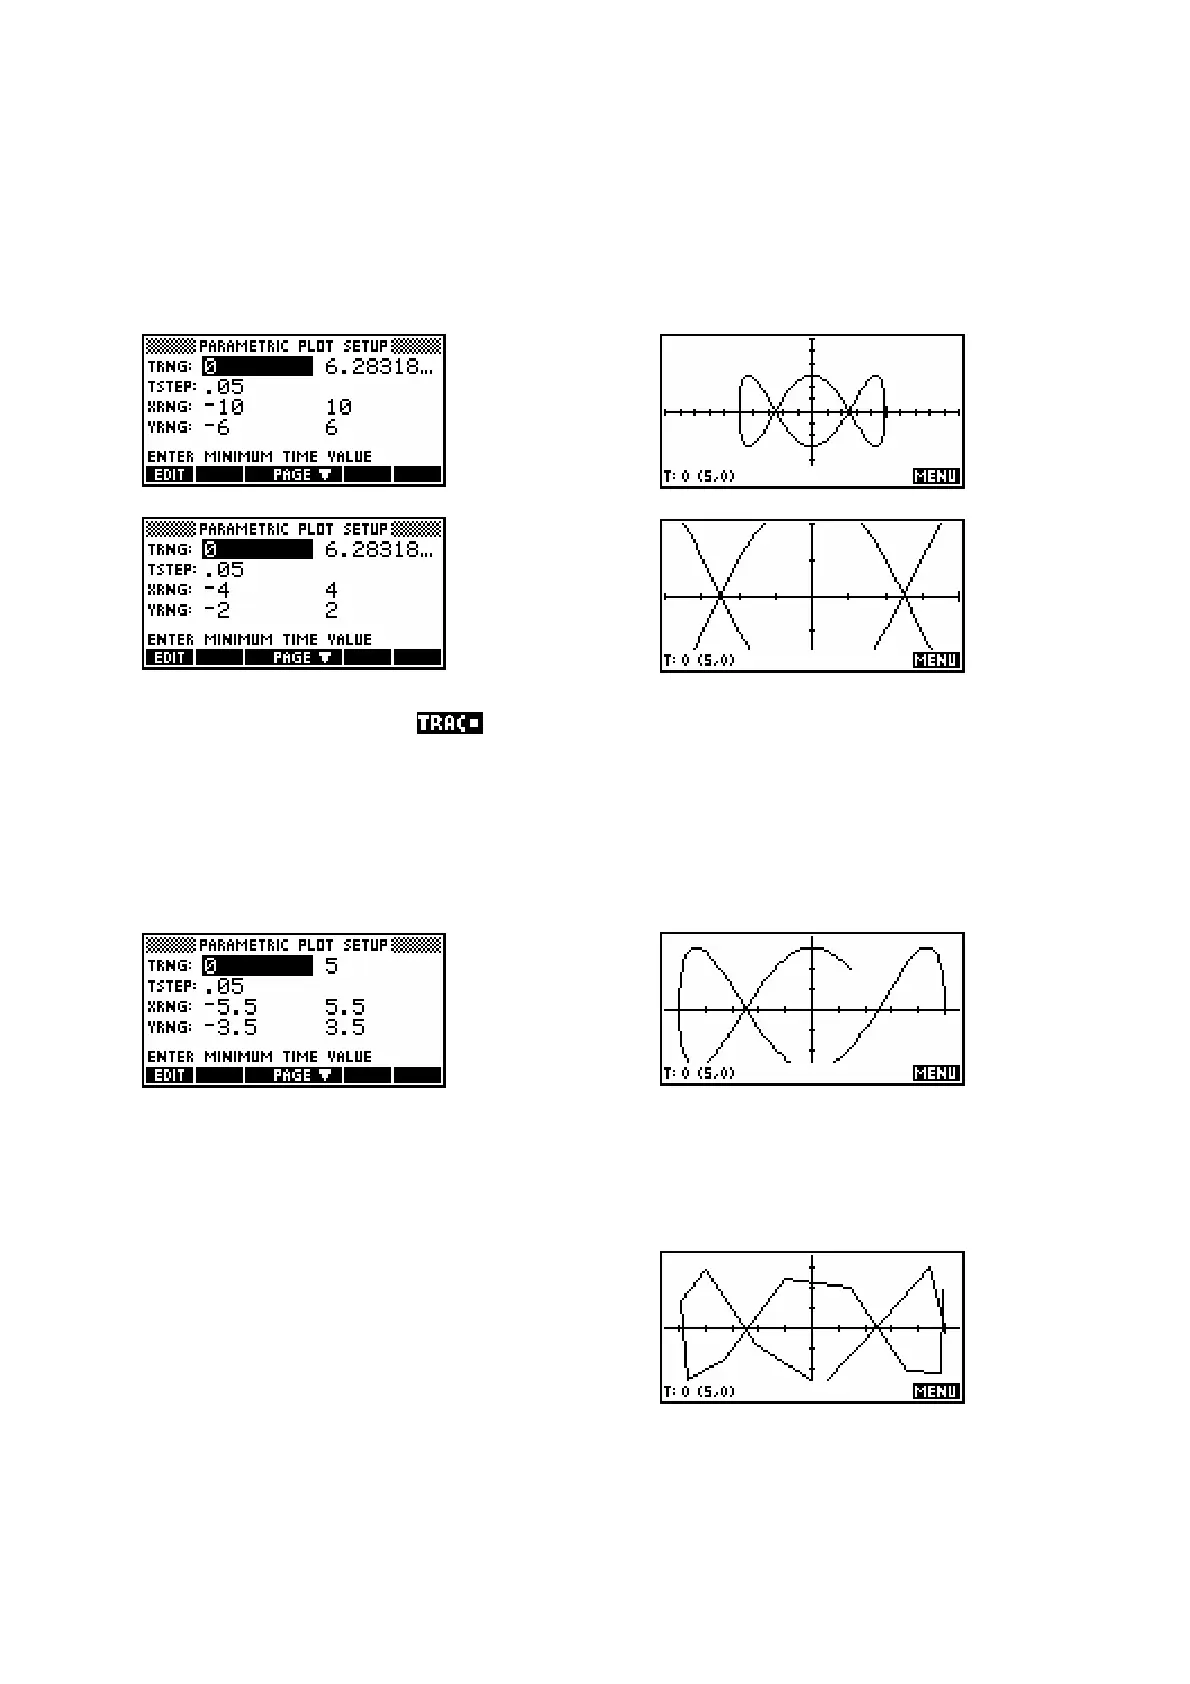
The X and Y ranges control the lengths of the axes. They determine how
much of the function, when drawn, that you will be able to see. For
example…
gives a graph of:
whereas..
gives a graph of:
Notice that in both cases, is on and shows the T value, followed by an
ordered pair giving (X,Y). Unlike XRng & YRng, the effect of TRng is to
decide how much of the graph is drawn at all, not how much is displayed of
the total picture.
For example…
gives a graph of:
As you can see
above, changing the T range from
02t
≤ to 05t
≤ gives a graph that
appears only partially drawn. What constitutes “fully drawn” depends, of
course, on the function used.
TStep controls smoothness
The value of the parameter TStep controls the
jump between successive values of T when
evaluating the function for graphing. Any
graph is always a series of straight lines, and
making TStep too large produces a graph
which is not smooth. The example on the right
shows TStep = 0.5 instead of 0.05.

 Loading...