148
Using Stats to find equations from point data
eg. 1 Find the equation of the quadratic which
passes through the points (1,5), (3,15)
and (-5,71).
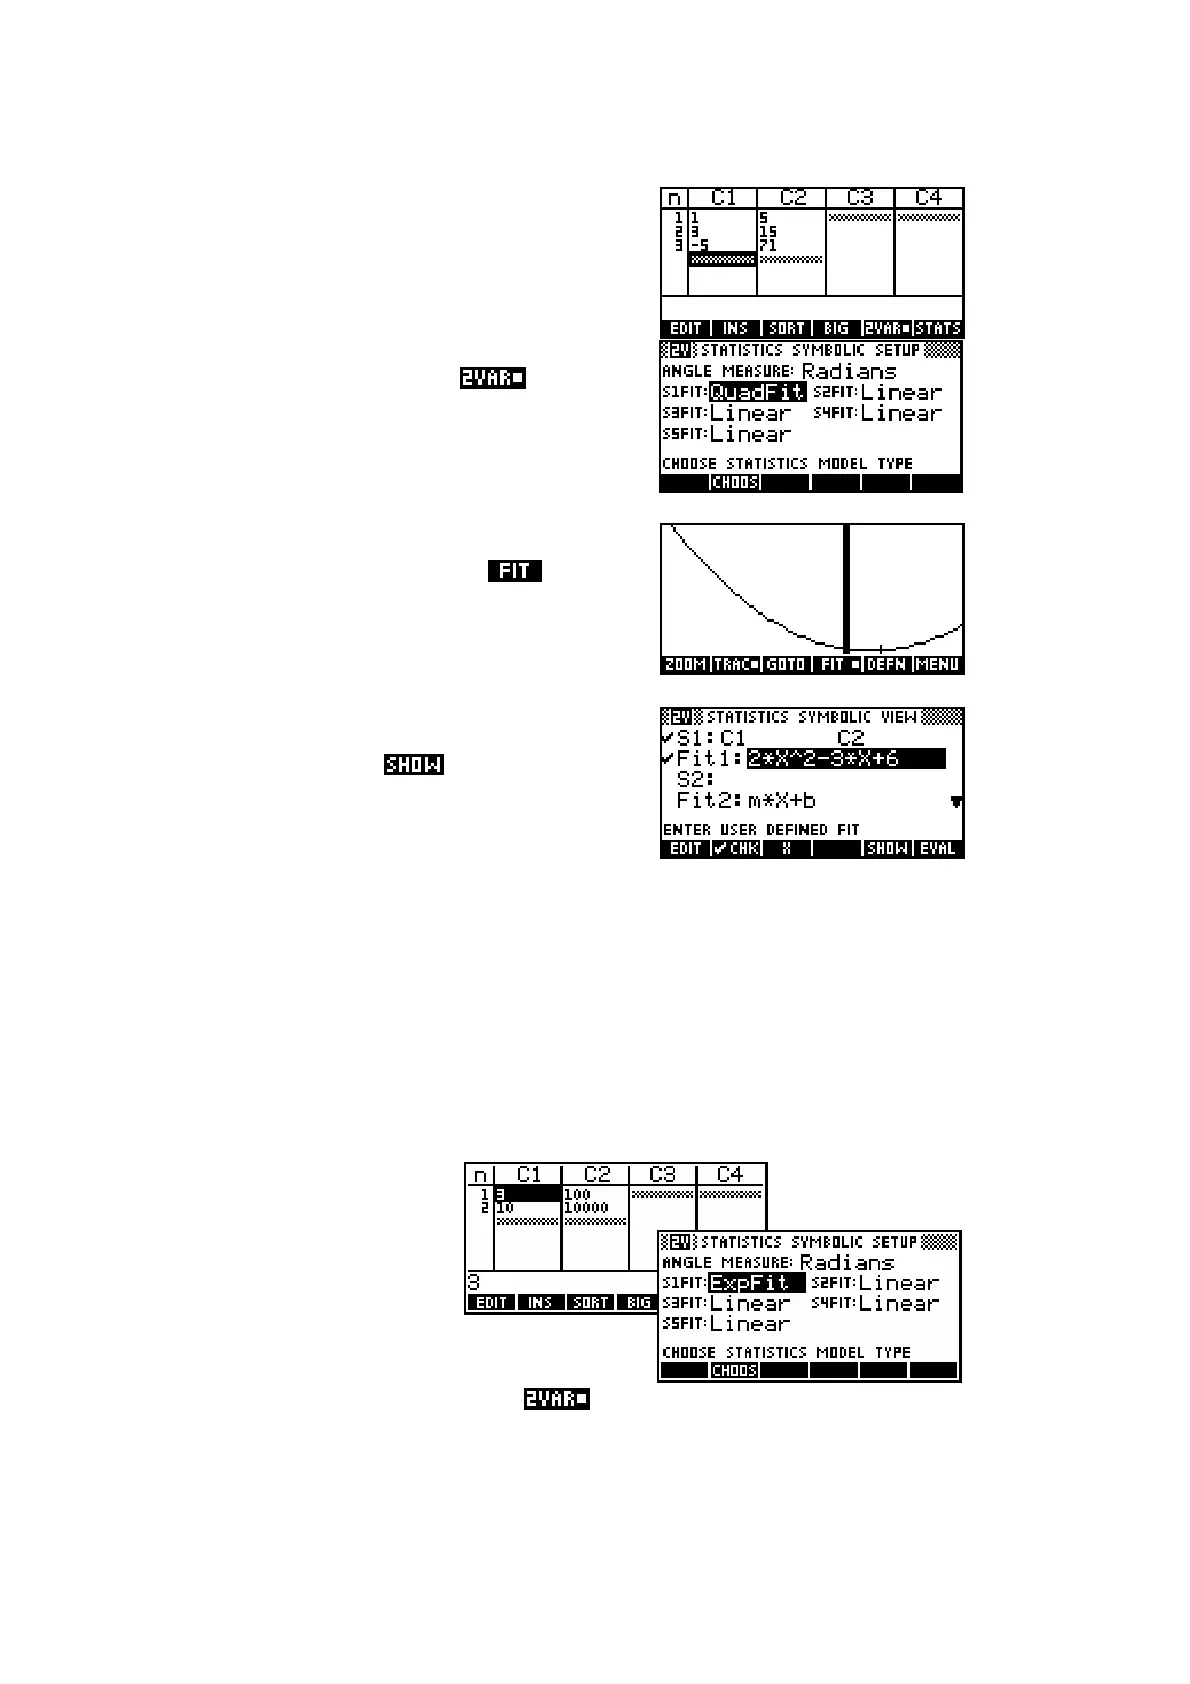
In the Statistics aplet, choose mode and
enter the data. Now change to the SYMB
SETUP view and choose the Quadratic data
model.
Change to the PLOT view using the VIEWS
Auto Scale option and press the key.
Don’t worry that the scale is not good because
we don’t care about the graph. It only needs to
be drawn in order to calculate the fit equation.
Finally, change back to the SYMB view and see
the equation, pressing if necessary.
eg. 2 A population of bacteria is known to follow a growth pattern governed
by the equation
0
;0
kt
NNe t=≥. It is observed that at t = 3 hours, there are
100 colonies of bacteria and also that at t = 10 hours there are 10 000
colonies.
(i) Find the values of
0
N and of k.
(ii) Predict the number of bacteria colonies after 15 hours.
(iii) How long does it take for the number of colonies to double?
(i) Find
0
N and k.
Start up the Statistics aplet, set it to
and enter the data given. Change
to the SYMB SETUP view and specify an Exponential model for the data.
 Loading...


