136
This may seem to be a useless model but it can be quite useful. For
example, suppose you had collected a set of data using a data logger and a
motion detector which you suspected might represent simple harmonic
motion.
There is no trig model supplied in the list of
models built-in but some work and
experimentation may allow us to find a valid
model and test its fit.
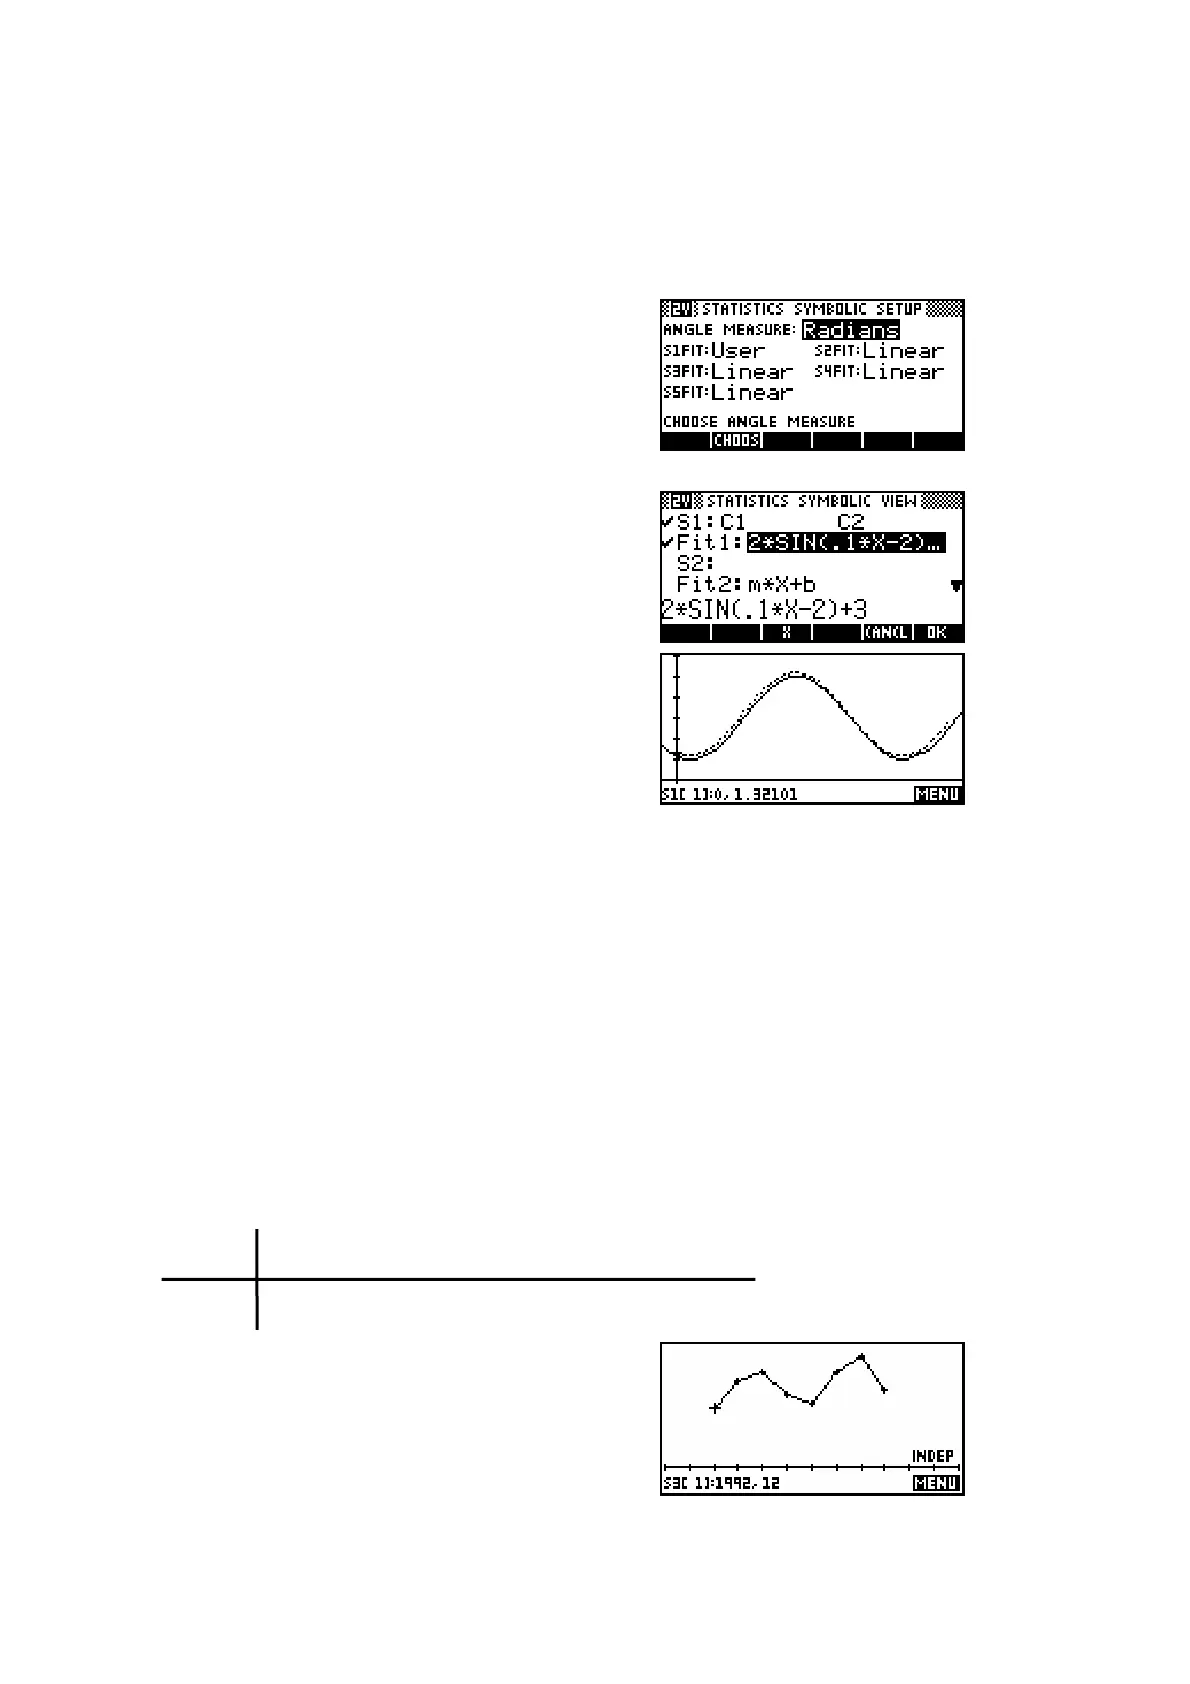
If we change into SYMB SETUP view and
select User Defined and then change back to
SYMB view then we can insert our model as the
fit curve. How to deduce the parameters in
this model I leave to you!
As you can see in the new PLOT view, the
curve we have deduced fits the data quite well.
How well is a matter for your judgment, aided
by the RelErr variable (see page 141).
Connected data
One of the settings on the second page of the PLOT SETUP screen can be
useful for some types of data. For example, one of the common tasks in
many mathematical courses is the analysis of time series data. Unlike most
bivariate data, time series values are usually plotted as a line graph - i.e. as
connected points. This facilitated by Connect.
For example:
The sales of an ice-cream shop are shown as quarterly sales figures for the
years 1992 to 1993. Display this data on a graph.
Yr 1992 1993
Qtr 1 2 3 4 1 2 3 4
Sales 12 18 20 15 13 20 23 16
($1000)
The result (with Connect checked) is shown
right. The X values were entered as 1, 2, 3, 4,
5, 6, 7, 8 rather than 1, 2, 3, 4, 1, 2,3, 4.

 Loading...