153
The test value for the Student-t and the sample mean are listed in the middle
of the screen and the rough position of these values is shown by a vertical
line in both the upper and lower diagrams. The regions for rejection of the
null hypotheses are shown at the very top of the screen by the ‘ R’ and
‘R ’.
We assume, by statistical theory, that the distance
)
x
is normally
distributed. If the null hypothesis is true then the mean of this new distribution
should be zero. Our result is indicating that our particular value of
()
x
− is
of such a size that if the null hypothesis is true then the probability of it
appearing by chance is less than 5%.
In this case, whether you work from the PLOT view or the NUM view, it is clear
from the evidence that the null hypothesis should be rejected, with less than
a 5% chance of this rejection being incorrect. The alternate hypothesis that
the mean is not 50 should be accepted. Of course in this case, despite some
boxes containing less than 50 matches, the actual mean seems to be above
50 so we can hardly condemn the company for putting more matches in the
boxes than they need to!
Confidence interval: T-Int 1-
µ
In the previous example we found that the evidence of our sample indicated
that the mean number of matches in the boxes was not 50. Suppose we now
want to know, at the 95% confidence level, within what range of values the
true population mean lies.
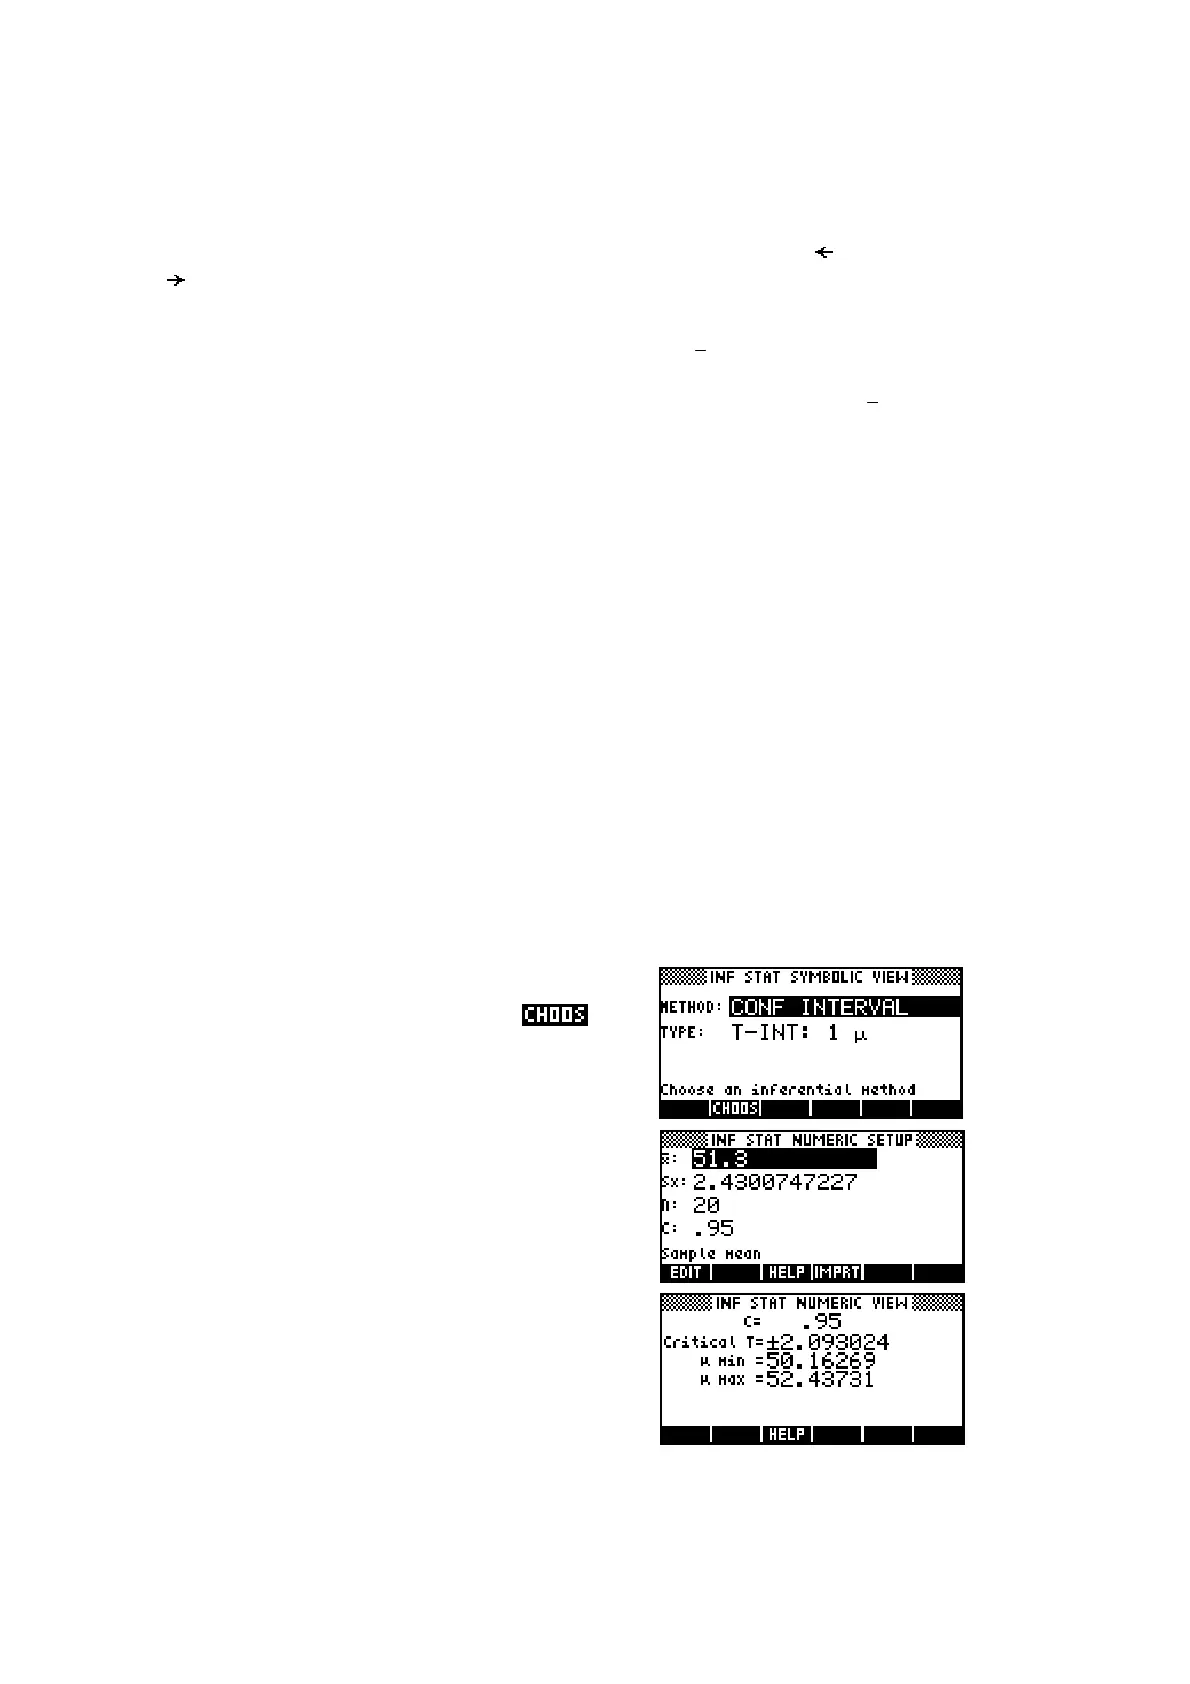
Change back to the SYMB view and
the
method of Conf Interval. The type of interval is
converted to the similar type of T-INT: 1
µ
.
In the NUM SETUP view use the import facility
as before to import the values from our sample
data. The default confidence level is 99% so
you will need to change that to 0.95.
Changing to the NUM view gives the minimum
and maximum values for the population mean
of 50.16 to 52.44 at a 95% confidence level.

 Loading...