140
We can make predictions from our line of best fit in two places - the HOME
view and the PLOT view. The hp 38g was able to do this only from the HOME
view.
Predicting using
PREDY
In the HOME view we use the functions PREDY
and PREDX from the Stat-Two section of the
MATH menu. The functions PREDX and
PREDY use whatever was the last line of best
fit calculated. It is up to you to ensure that the
one you want used was the one last graphed.
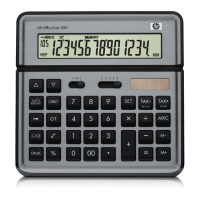
If I want to predict a y value for x = 3, then I simply type PREDY(3) into the
HOME view as shown right.
Many people choose to simply type ‘PREDY’ using the ALPHA button instead
of going through the MATH menu.
Predicting using the
PLOT
view
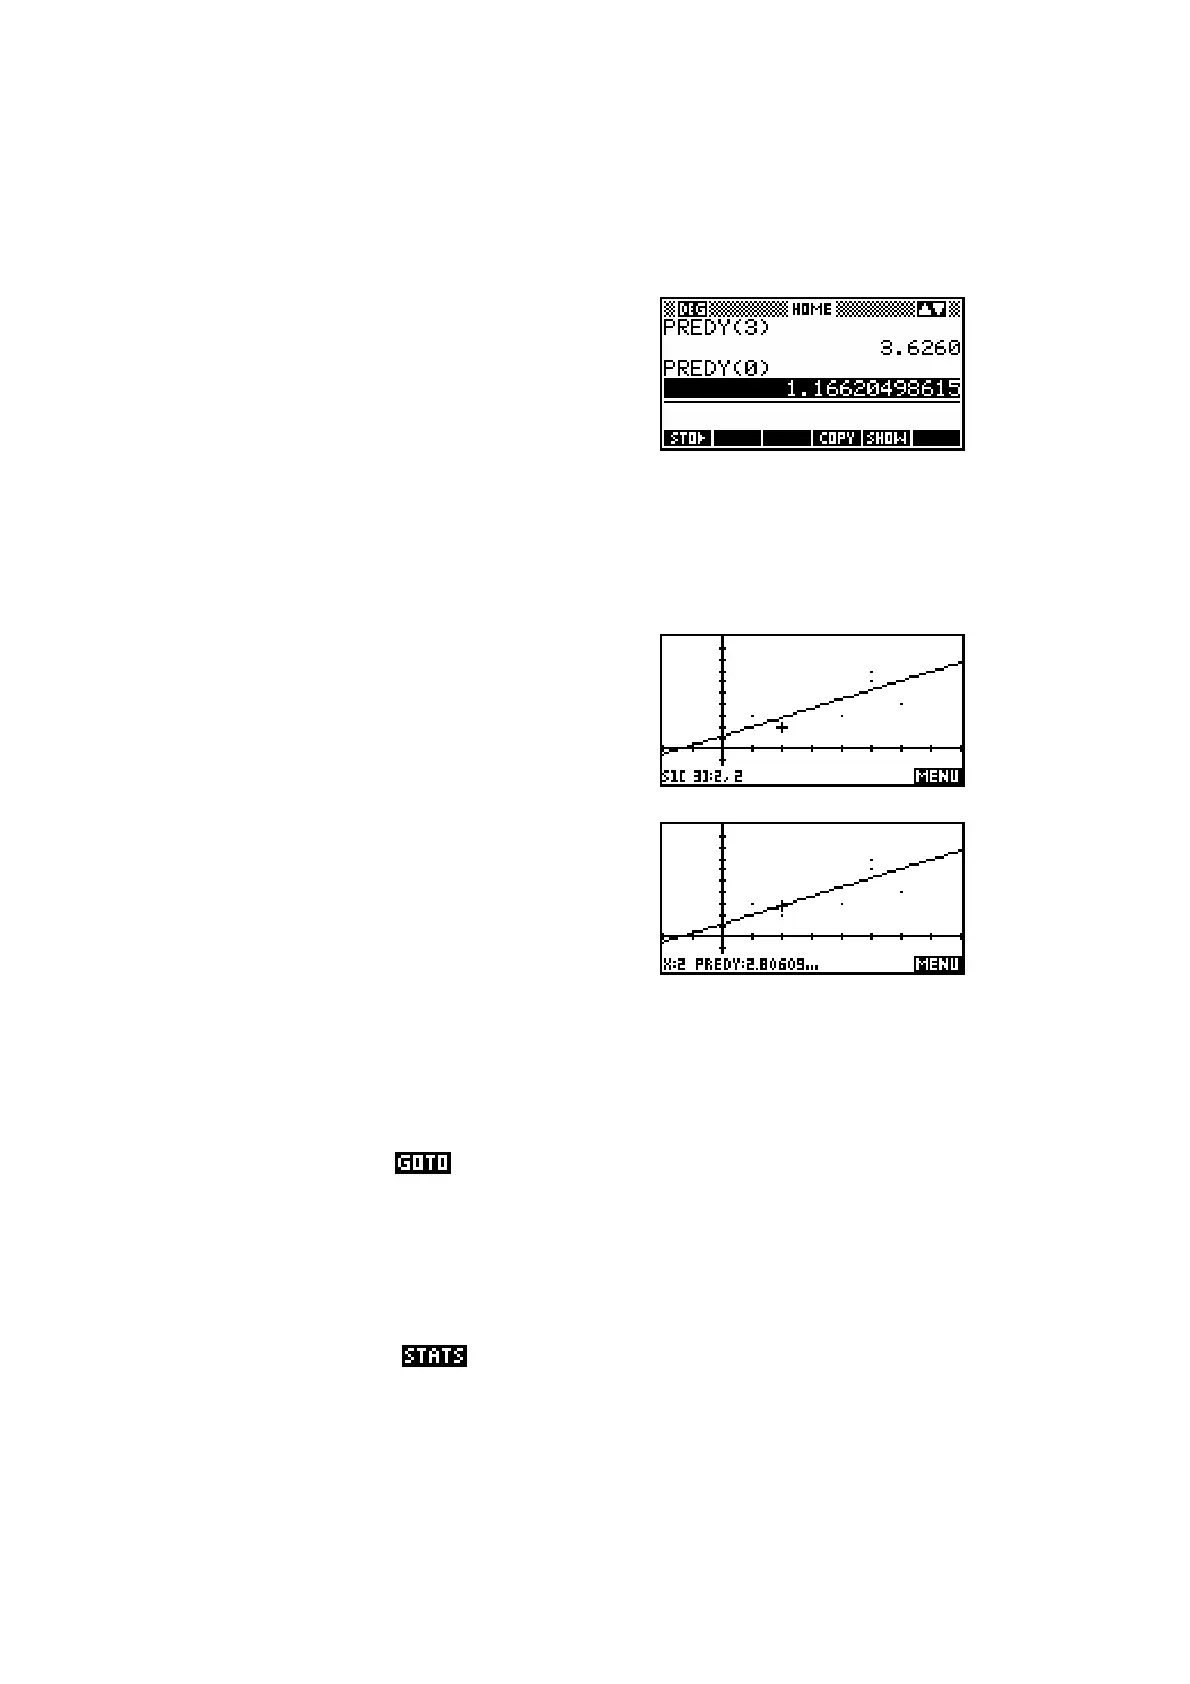
Using the PLOT view is the probably the more
visually appealing method of obtaining
predicted values. When you have plotted a set
of data and its fit curve then pressing up arrow
will change the focus of the values at the bottom of the screen from the data
points to the PREDY values. In the screen
snapshots shown right the focus changes from
data point 3 (2,2), to the PREDY value for x = 2
of 2.806.
If there is more than one data set (and fit lines) graphed then the up arrow
will move progressively from one to another and finally back to the first.
Pressing left and right arrows will move along the fit line but only on pixel
positions, which may not be suitable if the scale is not chosen carefully. A
better way is to use the key to obtain PREDY values for any required
value of x, including values which would normally be off-screen.
Another aspect of bivariate stats needs to be remembered when the fit
chosen is not linear. Mathematically, the correlation coefficient is a strictly
linear measure of the goodness of fit and this means that the correlation
coefficient quoted in the view is always for the linear model even when
the model chosen is not linear.

 Loading...