55
T
T
h
h
e
e
P
P
L
L
O
O
T
T
S
S
E
E
T
T
U
U
P
P
v
v
i
i
e
e
w
w
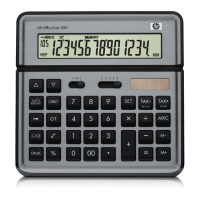
If you press SHIFT then PLOT you will see
something like the view on the right.
The highlight should be on the first value of ‘XRng:’. Enter the value -4.
Calculator Tip
Don’t use the subtract key to input a negative. You MUST
use the negative key labeled (-) which is in the same row
as the ENTER key.
Type in 4 for the other ‘XRng:’ value, then -20 and 20 for the ‘YRng:’
values. When you’ve done this use the arrow keys move to ‘Ytick:’ and
change it to 5.
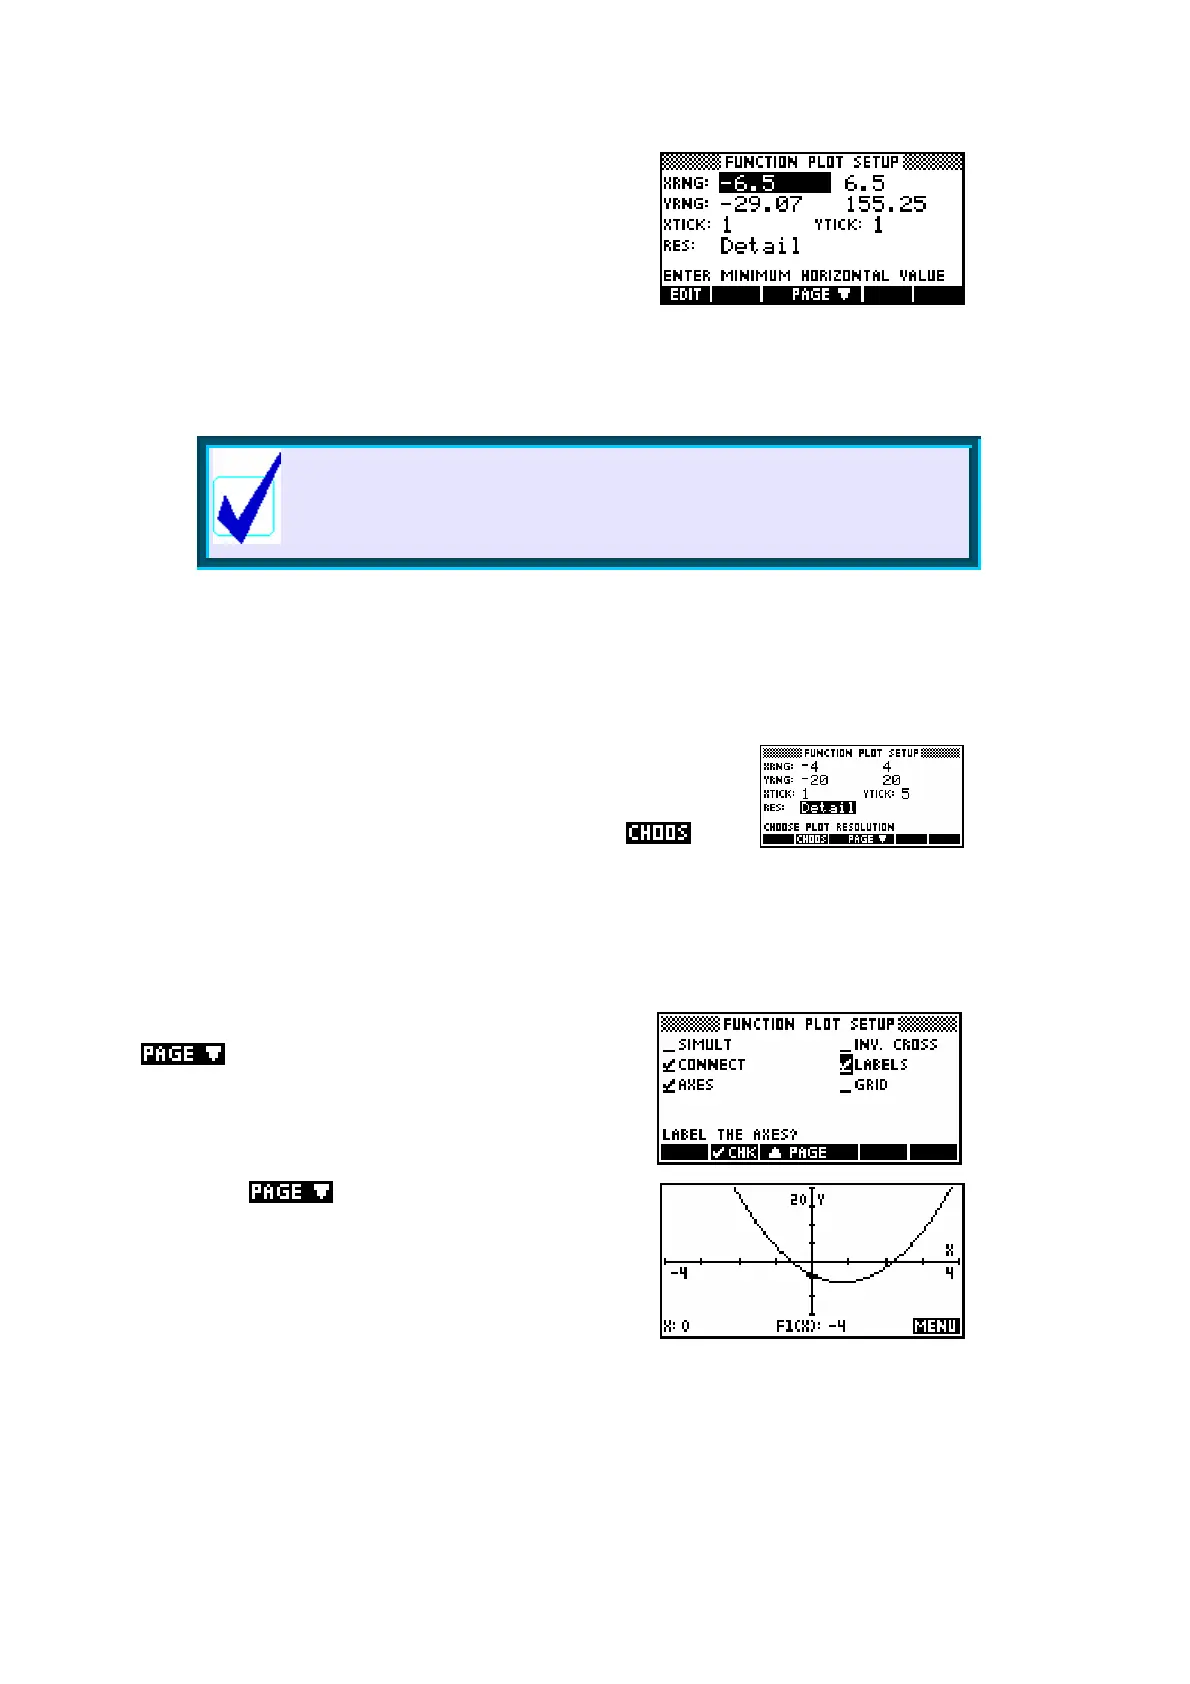
Detail vs. Faster
At the bottom of the screen you will see Res: (short for
‘Resolution’). If you highlight it and press the key
you will see that you have a choice of Faster or More Detail. More Detail
should be selected. If you choose Faster then every second dot is plotted
instead of every dot. This is quicker but may make some graphs appear less
smooth, particularly graphs with steep gradients.
There are two pages to this view (see the
key at the bottom of the screen). The
first page is used to set axes, the second to
control certain features of them.
Press the
key. You will now be
looking at the screen shown above right.
Using the arrow keys to move the highlight,
make sure that your checks/ticks match the
ones in my snapshot. Now press PLOT again.
Perfect!

 Loading...