137
Calculator Tip
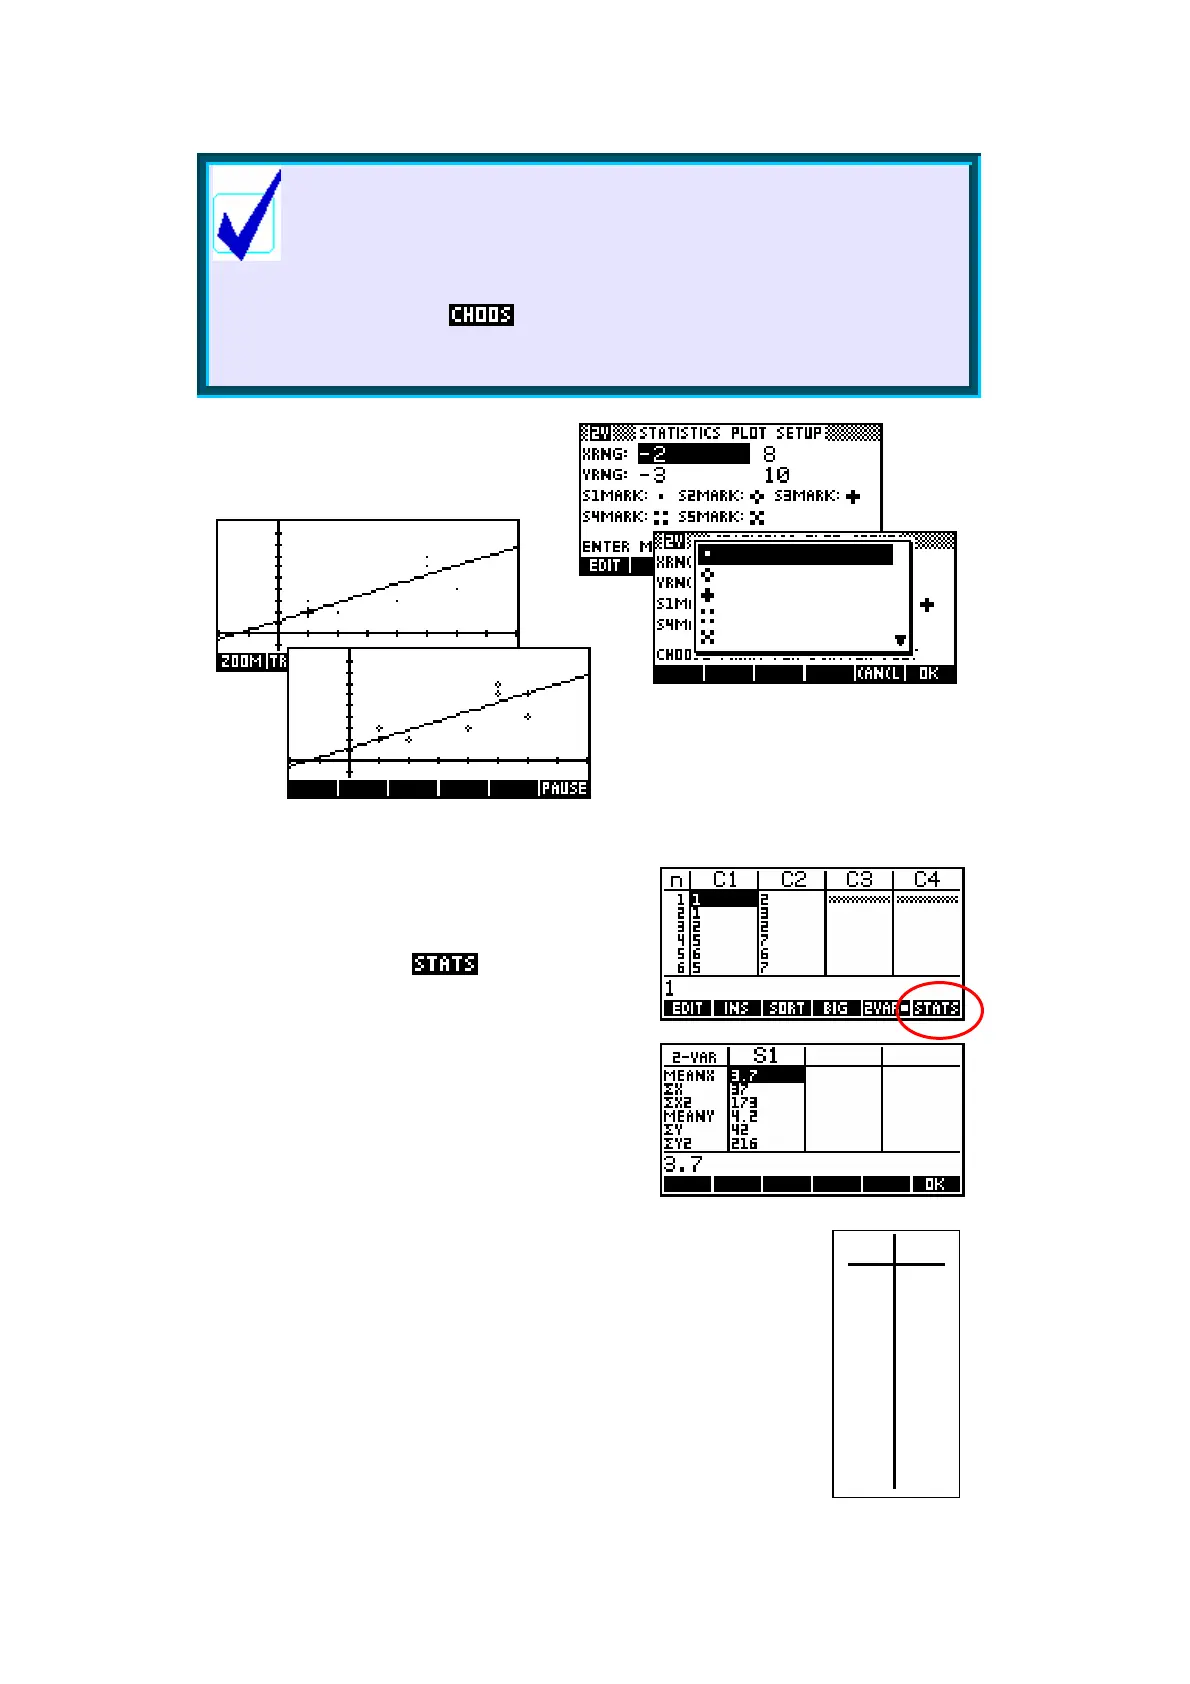
If you have trouble seeing the small dots that the hp 39g+
uses in its scatter-graphs by default then you will be
interested in the settings circled on the right. If you move
the highlight onto the mark for the data set you are using
and press then you will see the menu shown right
from which you can choose a different mark. The contrast
is illustrated below.
Two Variable Statistics
As with univariate statistics, summary statistics
are available through the key in the NUM
view (see right).
Pressing this key changes to a screen which
lists the following: MEANX, ΣX, ΣX
2
, MEANY, ΣY,
ΣY
2
, ΣXY, SCOV, PCOV, CORR and RELERR.
See page 141 for information on RelErr.
Let's use the set of data shown in the table on the right to go
through the analysis process a second time and this time
examine the line of best fit. The data is also listed in the box
below.
x
i
y
i
1 2
1 3
2 2
5 7
6 6
5 7
4 3
5 6
6 4
2 2

 Loading...