105
Example 2
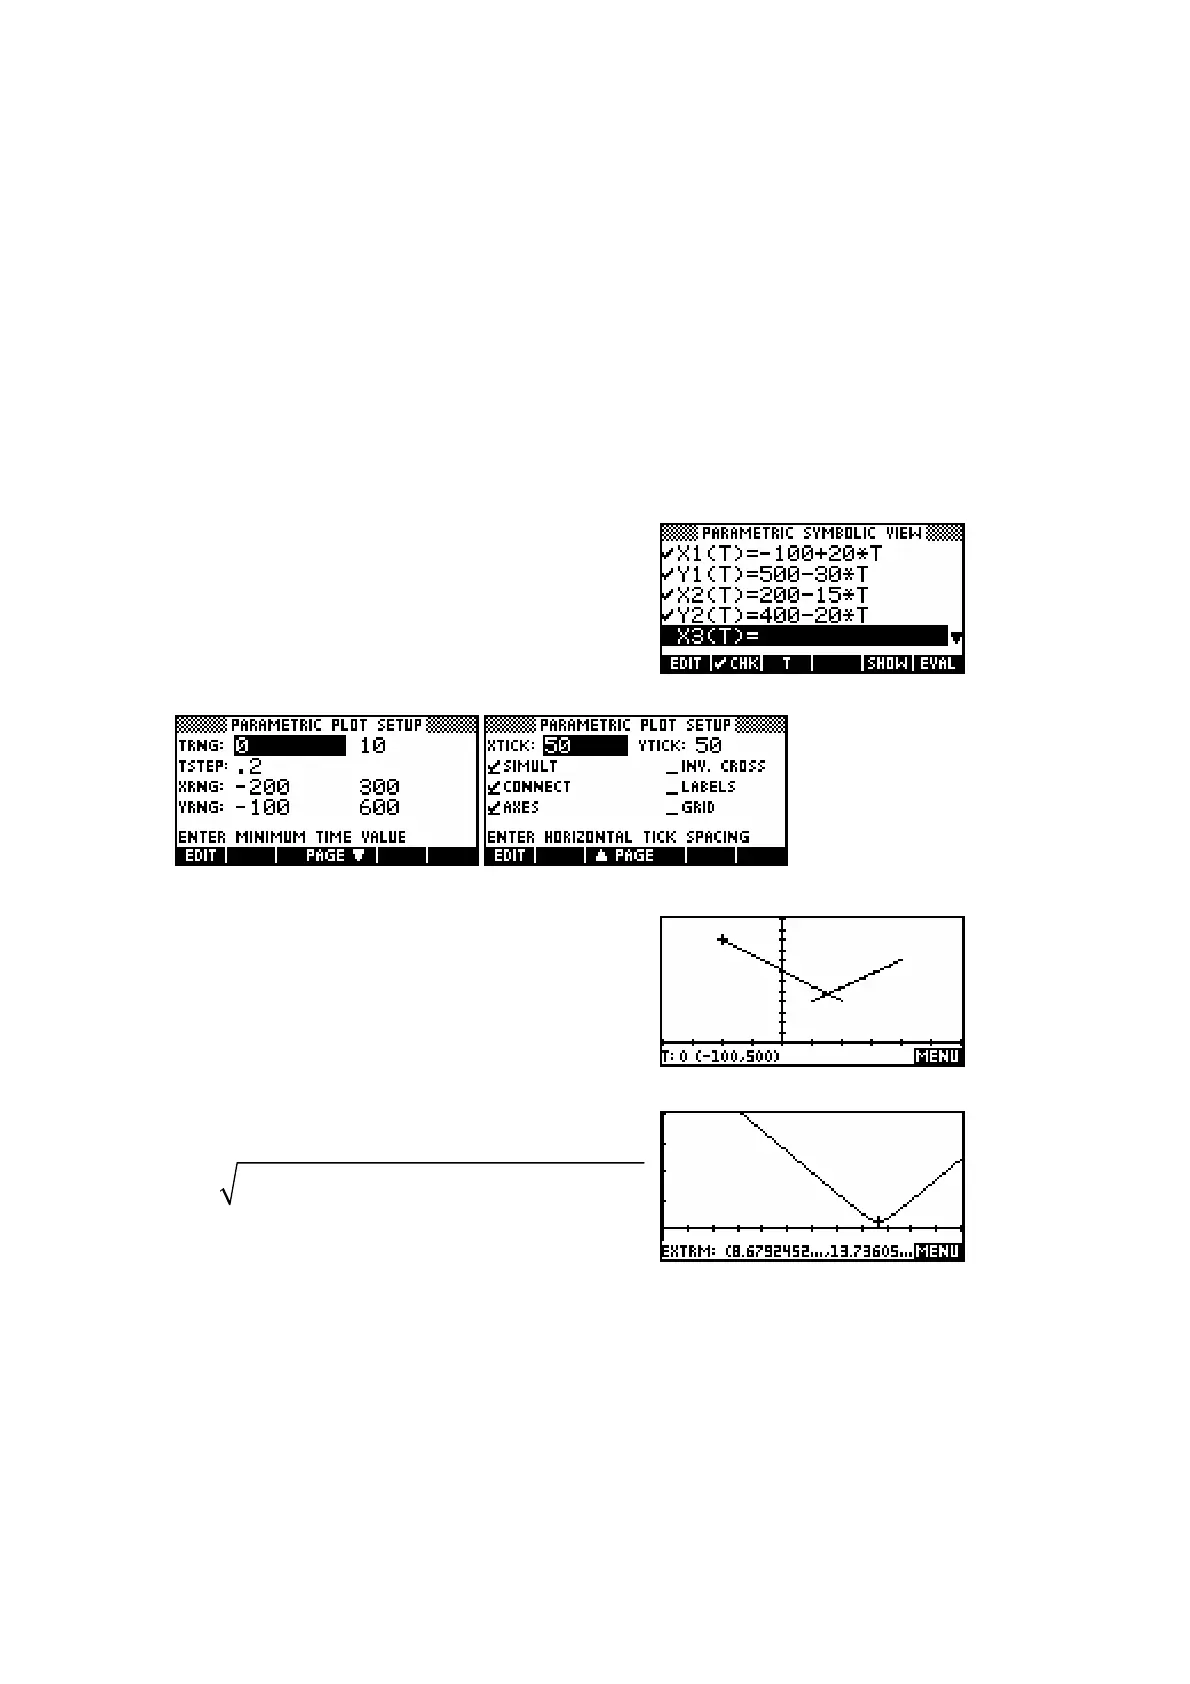
Two ships are traveling according to the vector motions given
below, where time is in hours and distance in kilometers.
Illustrate their motion during the first ten hours.
100 20
:
500 30
200 15
:
400 20
A
B
Ship A x t
Ship B x t
−
=+
−
−
=+
−
!
!
Enter the equations of motion as shown right.
Now change to the PLOT SETUP view and set
the axes to suitable values. Possible values
are shown below.
Now press PLOT to see the ships’ path appear.
As with the previous example, the value of
TStep is chosen to allow visible motion. As the
graph appears it can be seen that the ships do
not collide, even though the final plot may
make it appear that they do.
To find the distance between the two ships at
any time t, you can enter the equation
F1(X)=
()()
22
1( ) 2( ) 1( ) 2( )XX X X YX YX−+−
into the Function aplet. Note that the active
variable must be an X in the Function aplet
instead of the T of the Parametric aplet. Graphing this function will allow you
to find its minimum value. In this case the separation is minimized at t=8.68
hrs.
 Loading...


