For more information about tiering policy and groups, see “Tiering policy levels” (page 100).
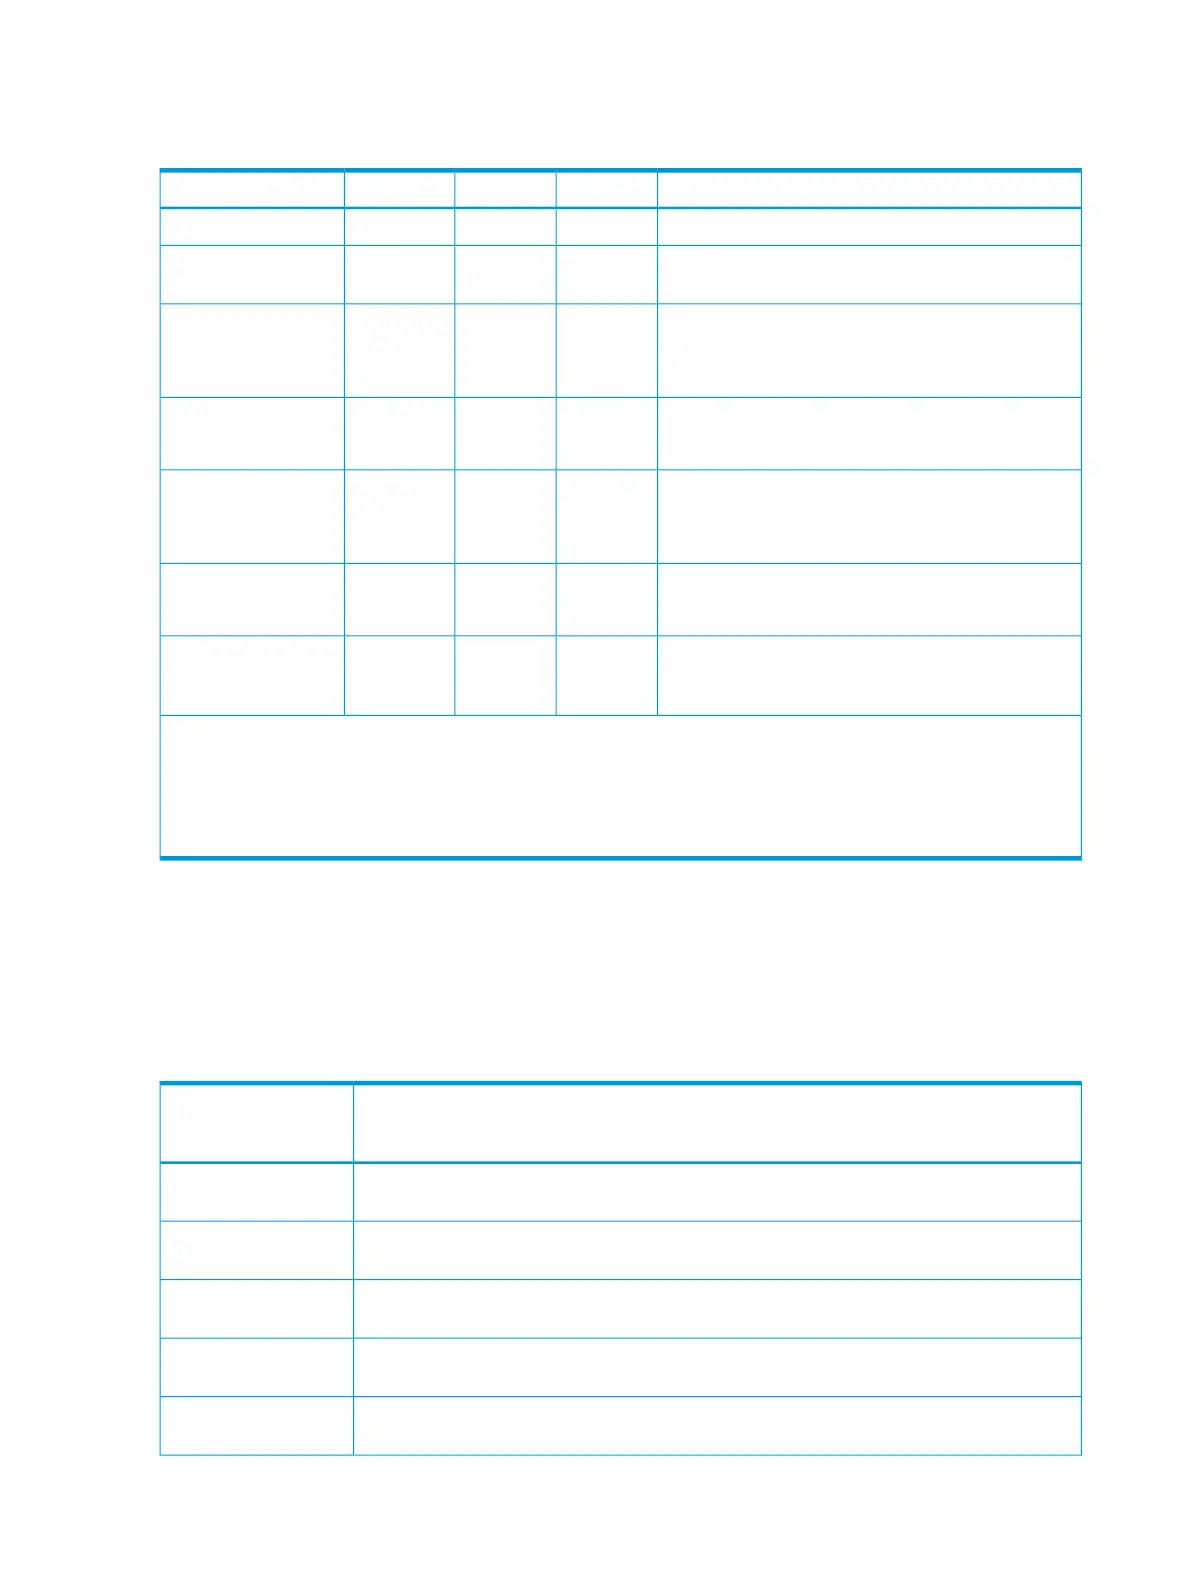
Tiering policy levels
Note3 tier pool2 tier pool1 tier poolTiering policy
Default Tiering PolicyAll 3 tiersBoth tiersSingle TierAll(0)
Data is located to the Top Tier. Any overflow moves
to the next lower tier.
Tier 1Tier 1Same as
All(0)
Level1(1)
Data is located to the Top Tier after Level1(1)
assignments are processed. Any overflow moves to
the next lower tier.
Tier 1 and
Tier 2
See note
Same as
All(0)
Same as
All(0)
Level2(2)
Data is located to the Middle Tier. Any overflow moves
to the top tier.
Tier 2
See note
Same as
All(0)
Same as
All(0)
Level3(3)
Data is located to the Middle Tier after Level3(3)
assignments are processed. Any overflow moves to
the next lower tier.
Tier 2 and
Tier 3
See note
Same as
All(0)
Same as
All(0)
Level4(4)
Data is located to the bottom tier. Any overflow moves
to the next higher tier.
Tier 3
See note
Tier 2Same as
All(0)
Level5(5)
Depends
on user
setting
Depends
on user
setting
Same as
All(0)
From Level6(6) to
Level31(31)
For example:
If additional capacity is added to the pool and the capacity defines a new Tier 1 or new Tier 2, then the THP V-VOLs
with a Level 5(5) assignment will not physically move but Level 5(5) will be associated with Tier 3.
If additional capacity is added to the pool and the capacity defines a new Tier 3, the THP V-VOLs with a Level 5(5)
assignment will physically move to the new Tier 3 and Level 5(5) will be associated with Tier 3.
Viewing the tiering policy in the performance graph
You can view the frequency distribution graph of the pool by selecting either the level of the tiering
policy or the entire pool on the performance graph in the View Tier Properties window.
The following table shows how tiering policy is shown in the performance graph. How the graph
appears depends on the number of tiers set in a pool and tiering policy level selected when viewing
the performance graph.
V-VOL displayed in the performance graphTiering policy selected
with performance
graph
In the performance graph, you can display a frequency distribution of a THP V-VOL, set to
all tiers.
All(0)
In the performance graph, you can display the frequency distribution of a THP V-VOL set to
level 1.
Level 1(1)
In the performance graph, you can display the frequency distribution of a THP V-VOL set to
level 2.
Level 2(2)
In the performance graph, you can display the frequency distribution of a THP V-VOL set to
level 3.
Level 3(3)
In the performance graph, you can display the frequency distribution of a THP V-VOL set to
level 4.
Level 4(4)
100 Configuring thin provisioning
 Loading...