5-30 Image Optimization
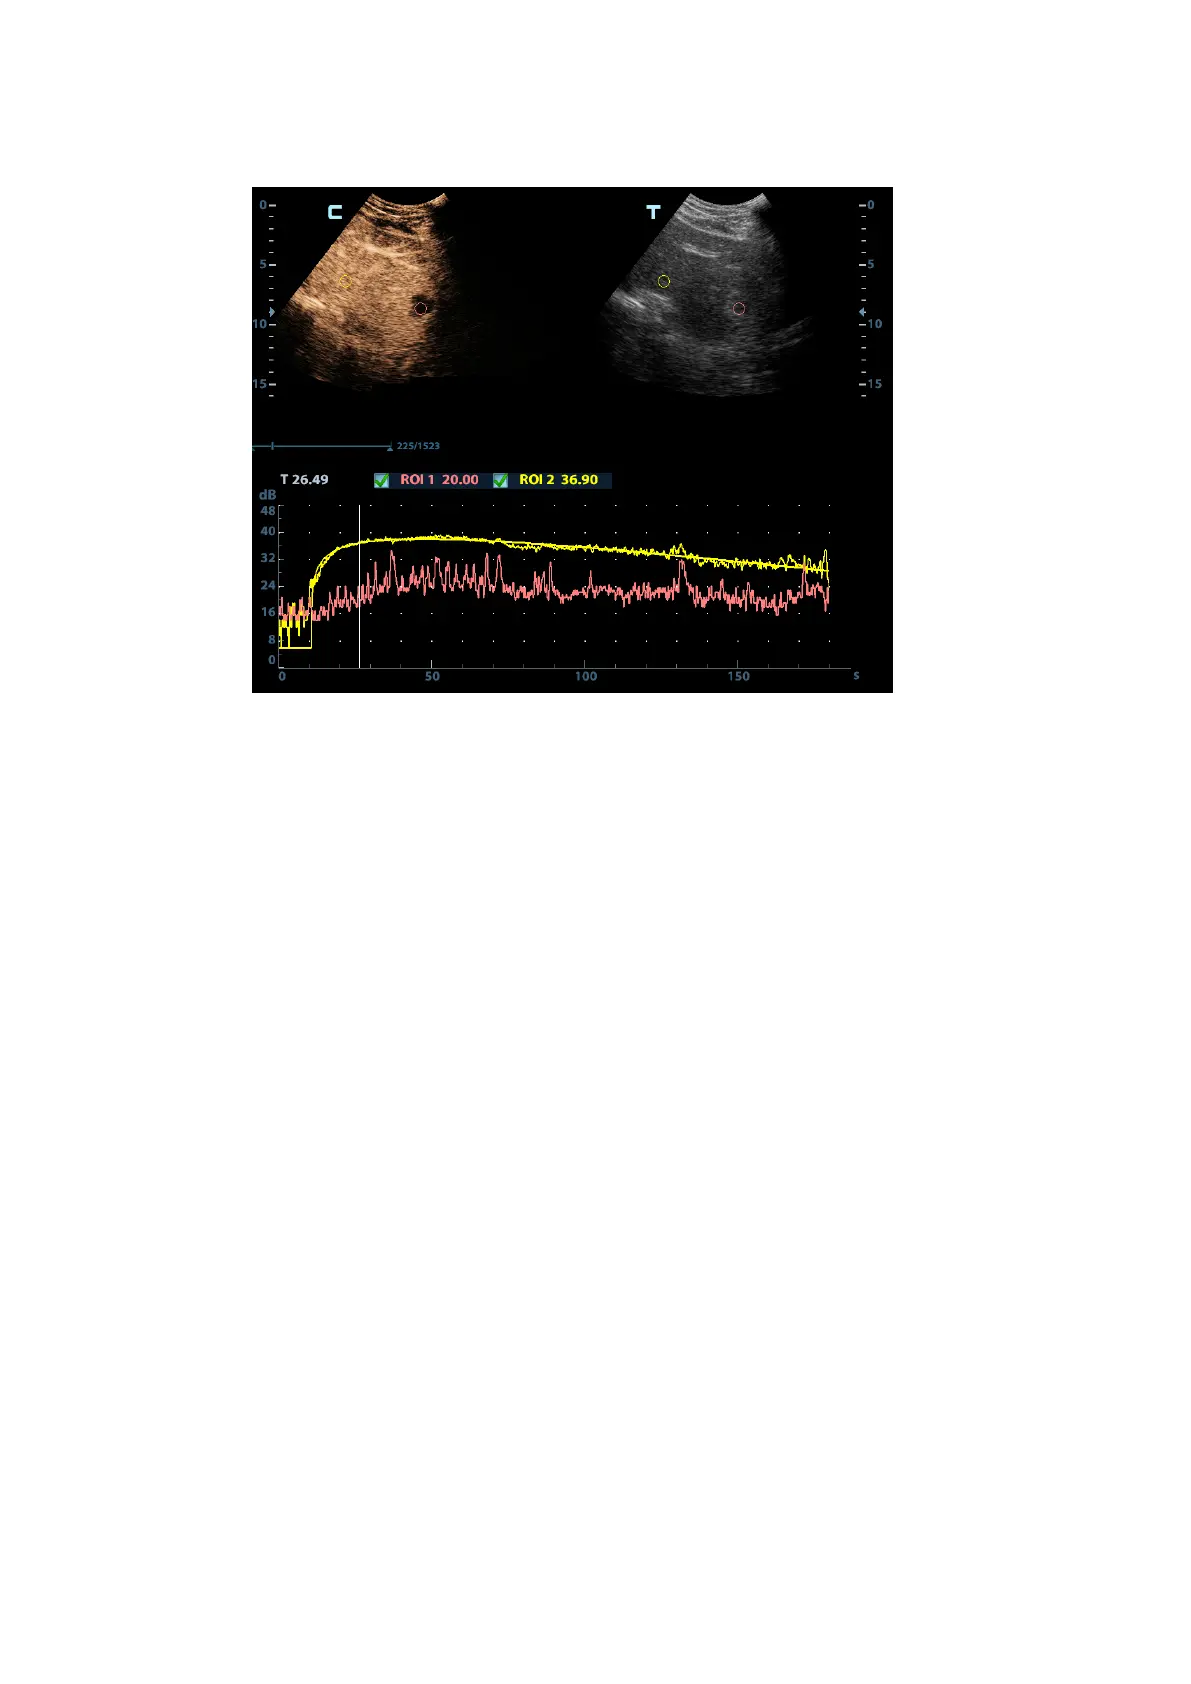
5.7.5.1 Contrast QA Screen
(For reference only)
1---Contrast cineloop window
Sample area: indicates sampling position of the analysis curve. The sample area is color-
coded, 8 (maximum) sample areas can be indicated.
2---B Cineloop window
Sample areas are linked in the contrast cineloop window and B cineloop window.
3---Time-intensity curve
Y axis represents the intensity (unit: dB), while X axis represents the time (unit: s).
Frame marker: a yellow line that is perpendicular to the X axis, can be moved horizontally
left to right (right to left).
Tap the check box beside the ROI to set if to hide or to display the QA curve.
To get the current X/Y axis value; tap [Show Curve Value] to activate the function, and a
green line is displayed. Move the green line, and the corresponding X/Y axis value is
displayed.
5.7.5.2 Basic Operations of Contrast QA
QA Analysis Image Range
The system set the starting time and ending time of the cine to be first frame and last frame of QA
analysis range.
Setting ROI
This function is used for setting the target.
Up to eight ROIs can be saved on the reference image, with the corresponding eight traces plotted
simultaneously on the graph. Each ROI display has a different color, and its corresponding trace
data is plotted using that same color.
There are two different methods for determining the shapes of the sample area: Standard ROI and
Freehand ROI.
 Loading...