V Series Operating Instructions 19 - 13
Bispectral Index (BIS) (Optional) BIS Tile Layout
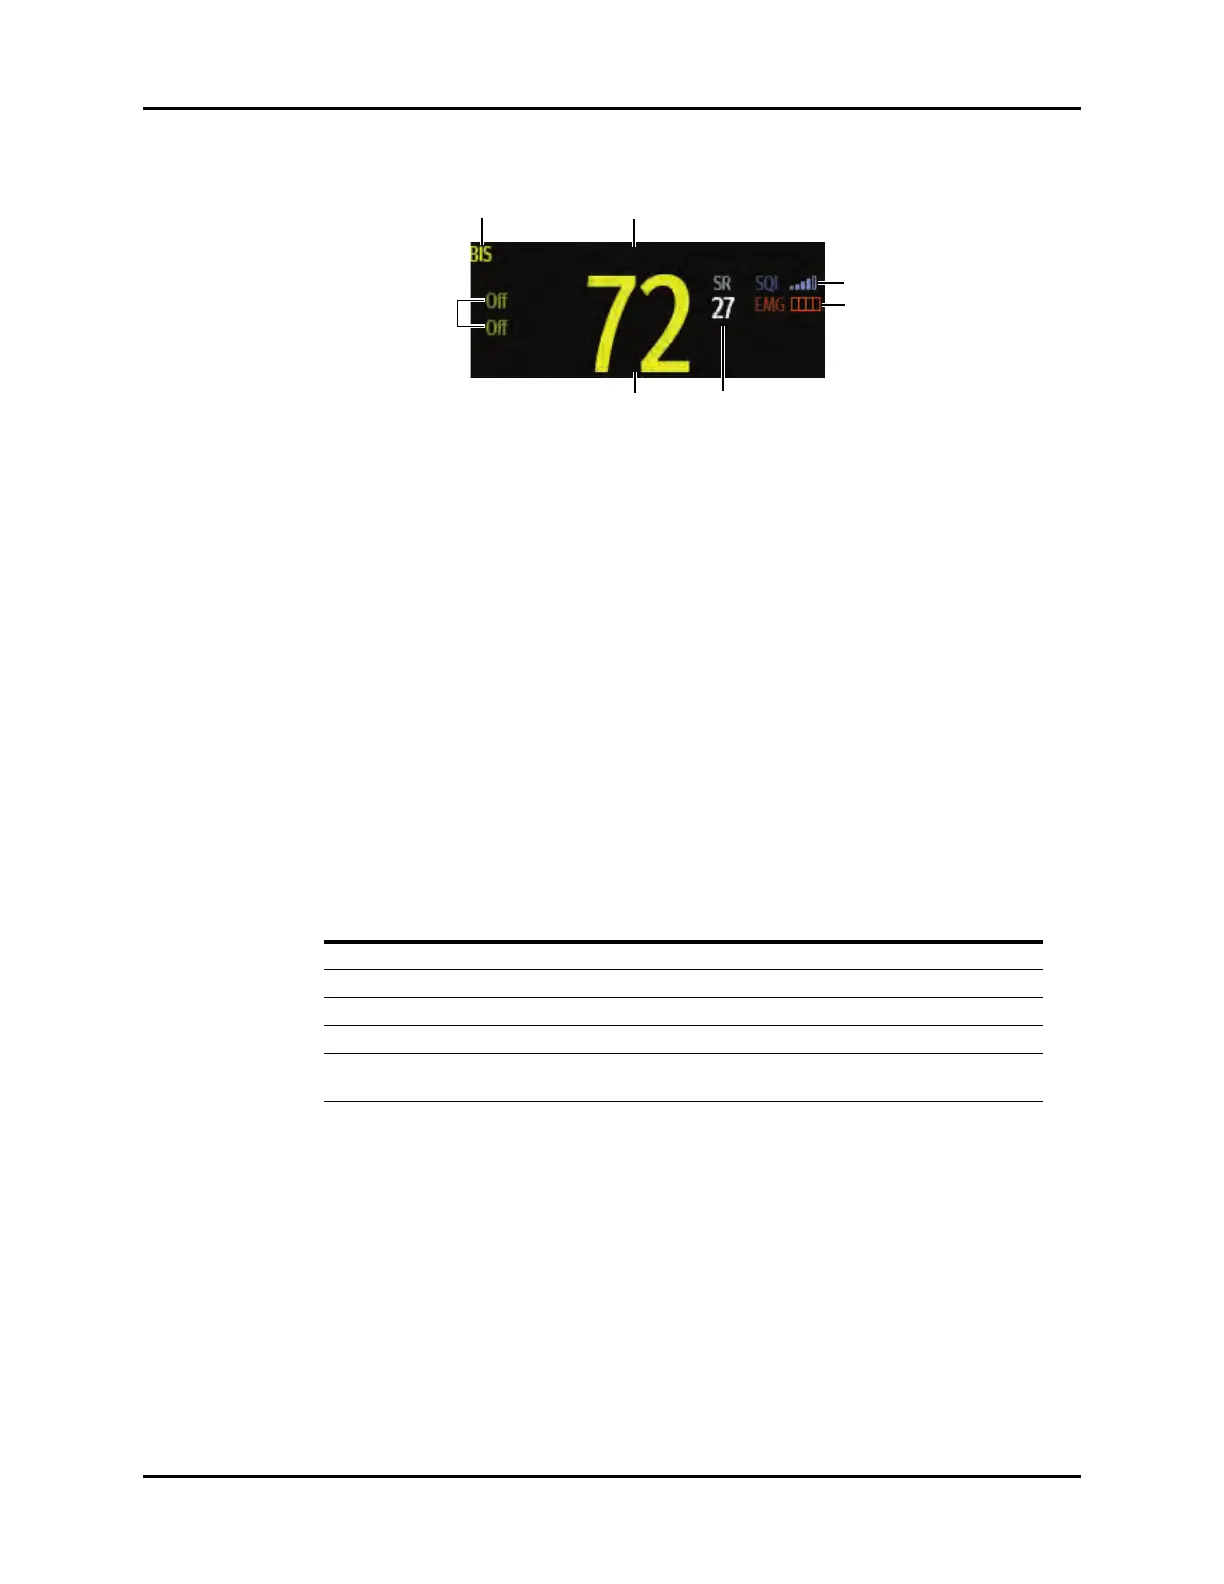
FIGURE 19-9 Example BIS Digital Tile for a Unilateral Sensor
19.4.2 About the BIS Digital Tile
• If the measurement is invalid, “- -” displays in place of digits.
• The BIS digital tile displays the value in a hollow font (as shown in FIGURE 19-8), when the SQI
value is either equal to or lower than 50%.
• The SQI value displays as a bar graph with five (5) sections, each section represents 20%.
• The EMG value displays as a bar graph, which represents the range of 30 to 55 dB.
19.4.3 About the BIS Parameters
The BIS digital tile displays the BIS, EMG, SQI, and SR parameters for BIS monitoring of a single side of
the brain.
• Bispectral Index (BIS)
The BIS numeric reflects the patient’s level of consciousness. It ranges from 100 for wide awake to
0 in the absence of brain activity.
• Electromyograph (EMG)
EMG bar graph reflects the electrical power of muscle activity and high frequency artifacts. The
power range is 30-55 dB. When the EMG indicator is low, it indicates that EMG activity is low.
• EMG≥55 dB: this is an unacceptable EMG, and the bar is full.
• EMG<55 dB: this is an acceptable EMG.
• EMG≤30 dB: this is an optimal EMG, and the bar is empty.
• Signal Quality Index (SQI)
The SQI numeric reflects signal quality and provides information about the reliability of the BIS,
SEF, TP, and SR numerics during the last minute. Signal quality is optimal when all five bars of the
SQI icon are filled with color. SQI ranges from 0-100%.
• 0 to 15%: the numerics cannot be derived.
BIS NUMERIC DESCRIPTION
100 The patient is wide awake.
70 The patient is underdosed, but still unlikely to become aware.
60 The patient is under general anesthesia and unconscious.
40 The patient is overdosed and in deep hypnosis.
0 The EEG waveform is displayed as a flat line, and the patient has no electrical brain
activity.
 Loading...