9 Visualization
Maschinenfabrik Reinhausen GmbH 2020246 4453918/14 ENETOS
®
TD
► Go to Information > Active part > DGA > Dörnenburg.
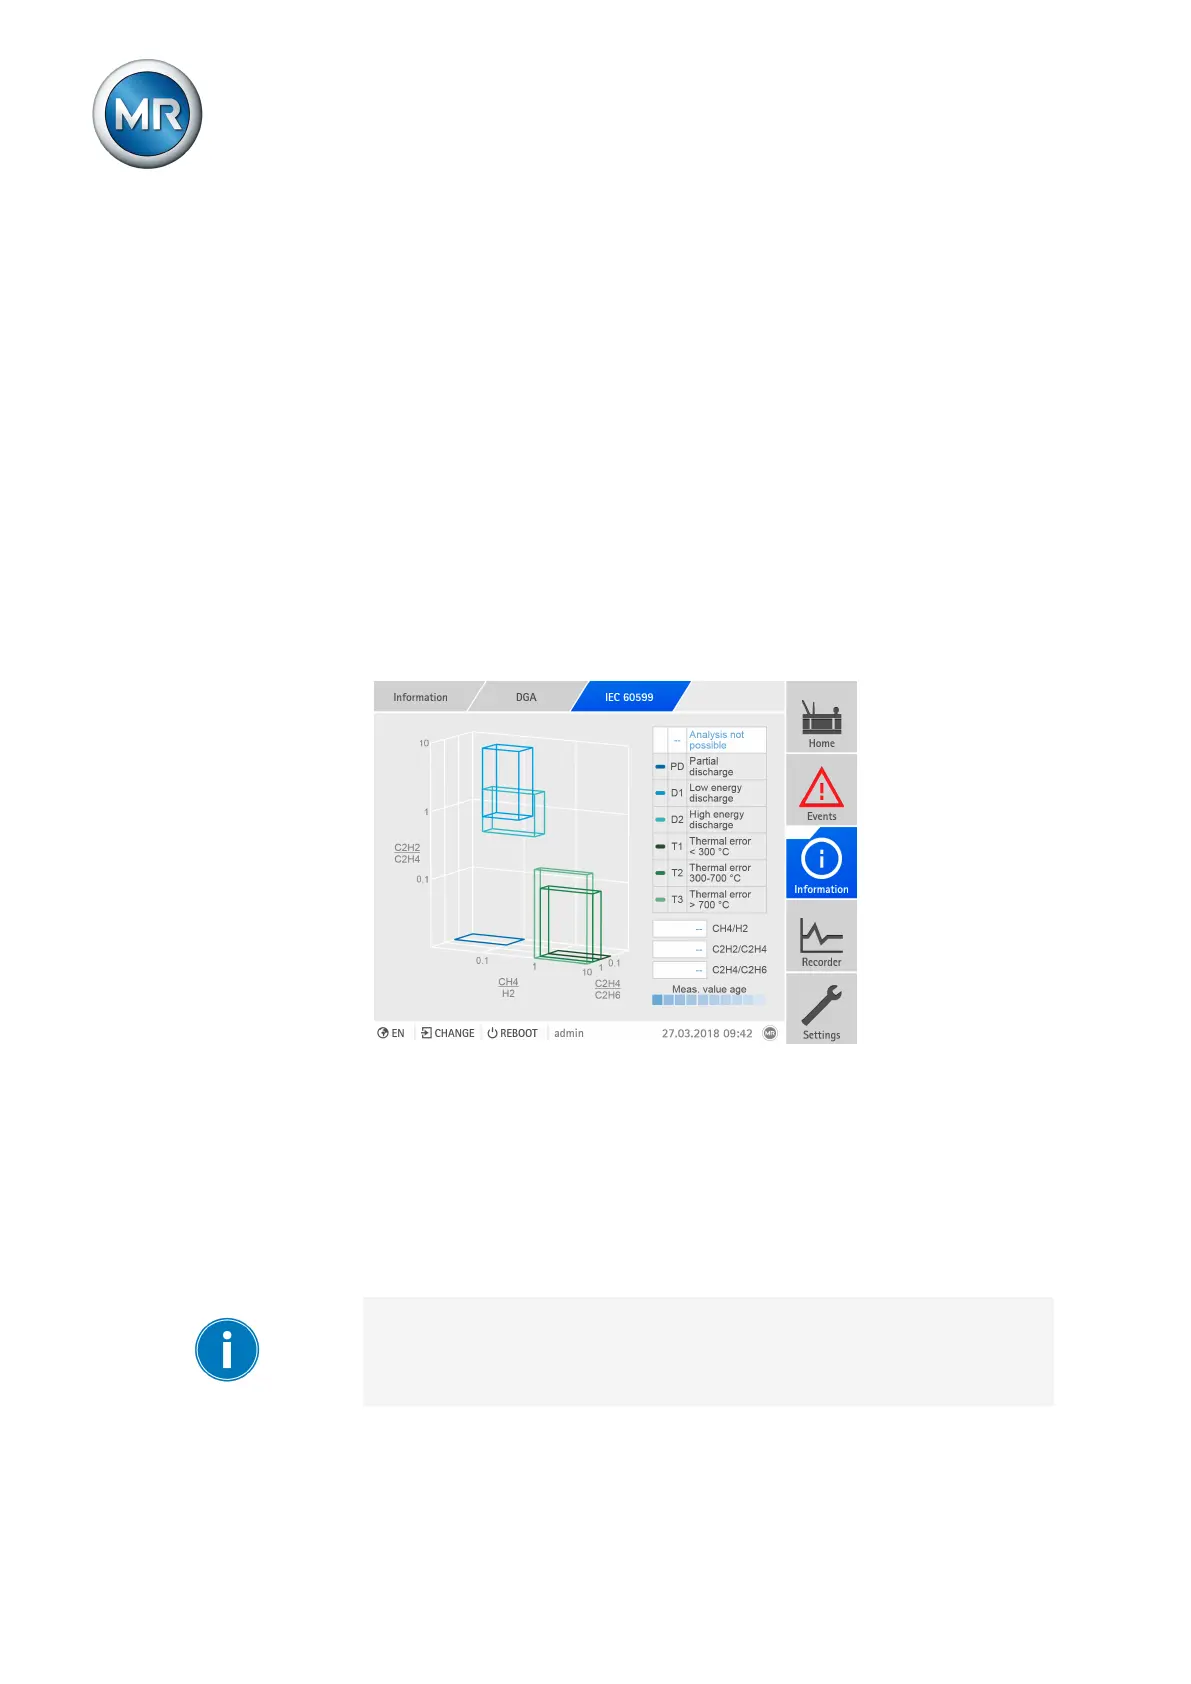
9.27.2.7 IEC 60599 analysis
The display of the IEC60599 analysis shows the following information:
▪ 3D diagram, with the allocation of the last 10 measured values in the ar-
eas of the various error types.
– Latest measured value: Darkest area with a display of the measure-
ment error.
– Earliest measured value: Lightest area
▪ Display of the error types. The error type of the latest measured value is
highlighted in white.
▪ Proportion of the gas concentrations of the latest measured value
If you call up the visualization using a PC, the proportions of the gas concen-
trations and the time of the measurement are displayed for each measured
value via tooltip. Furthermore, you can rotate the diagram using the mouse.
Figure180: Display of the IEC60599 analysis
► Go to Information > Active part > DGA > IEC60599.
9.28 MR sensor bus
The optionally available MR sensor bus function lets you connect digital and
analog sensors to the device over Modbus RTU. The MR sensor bus sup-
ports the connection of up to 31 sensors (Modbus slaves). The ISM® device
operates as the Modbus master.
Ensure that no other Modbus master is connected over the MR sensor bus.
Assign a unique Modbus address to each sensor you are connecting over
MR sensor bus. The MR sensor bus may experience errors if multiple sen-
sors are using the same Modbus address.
 Loading...