9 Visualization
Maschinenfabrik Reinhausen GmbH 2020274 4453918/14 ENETOS
®
TD
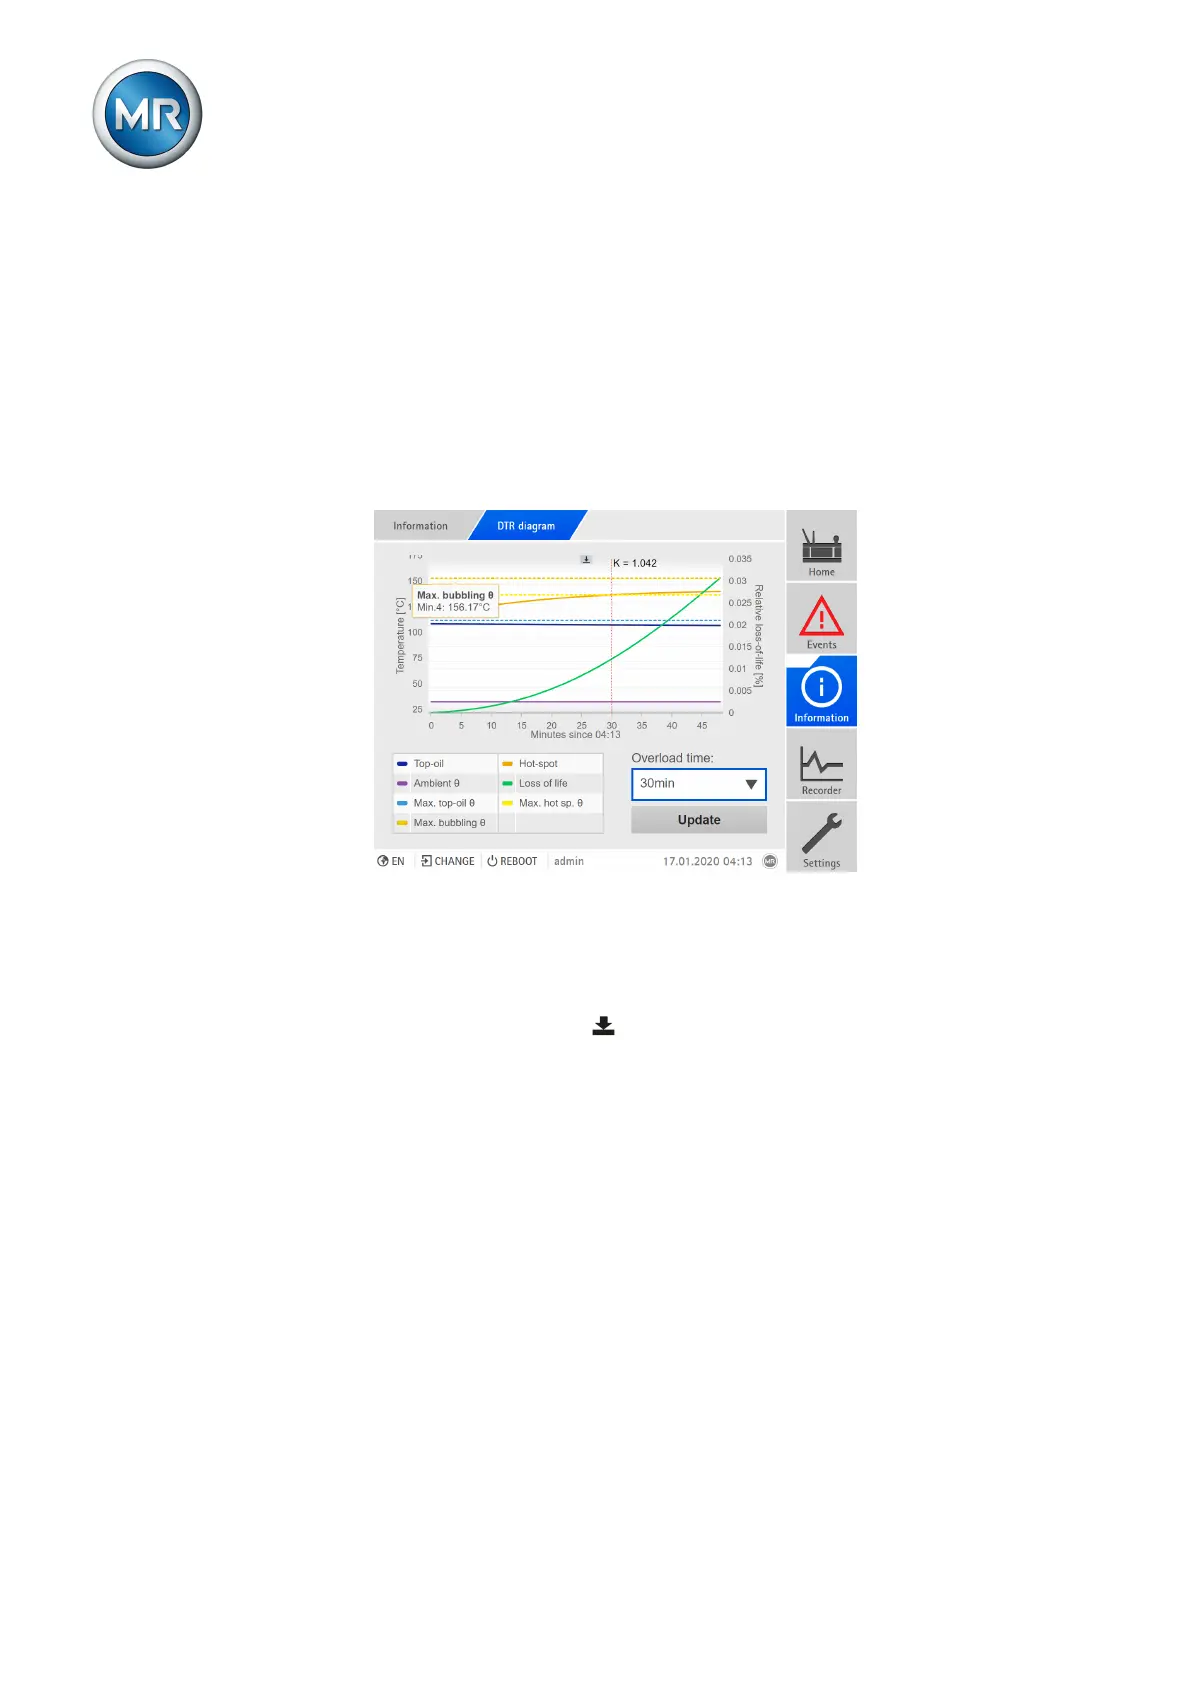
DTR diagram
In this menu, you can display the calculated values graphically. For the se-
lected overload period, the diagram shows the permissible load factor K and
the forecast progression of the temperatures (hot-spot, top-oil) as well as the
associated limit values. Furthermore, the diagram shows the progression of
the forecast loss-of-life and the ambient temperature at the time of the calcu-
lation.
If you call up the visualization via a PC and your user role is either "Diagnos-
tics", "Parameter Configurator" or "Administrator", you can export the DTR
diagram data values as a csv file.
Figure207: DTR diagram
1. Go to Information > Active part > DTR diagram.
2. Select the desired Overload period.
3. If necessary, select the Update button to update the view.
4. If required, select the button to export the overload diagram data.
9.33 Event management
The device is equipped with event management, which allows you to detect
various device operating statuses and to adapt the behavior of the device.
An overview of all possible events is given in the Event messages chapter.
9.33.1 Displaying and acknowledging events
To display the events currently active, proceed as follows:
► Go to Events.
ð A list of events currently active appears.
 Loading...