&
MKR
a
1
025
MHz
REF 0
*m
AlTEN
40
dB
-54
04
dB
PEAK
LUG
10
dB/
WA
58
SC FS
CORR
1
I
I
I
I I
I
I I
CENTER 300.650 MHz
SPAN 5 000 MHz
XRFS
RW
3
kH7
“RW
3
kH7
SW
1
7 CPT
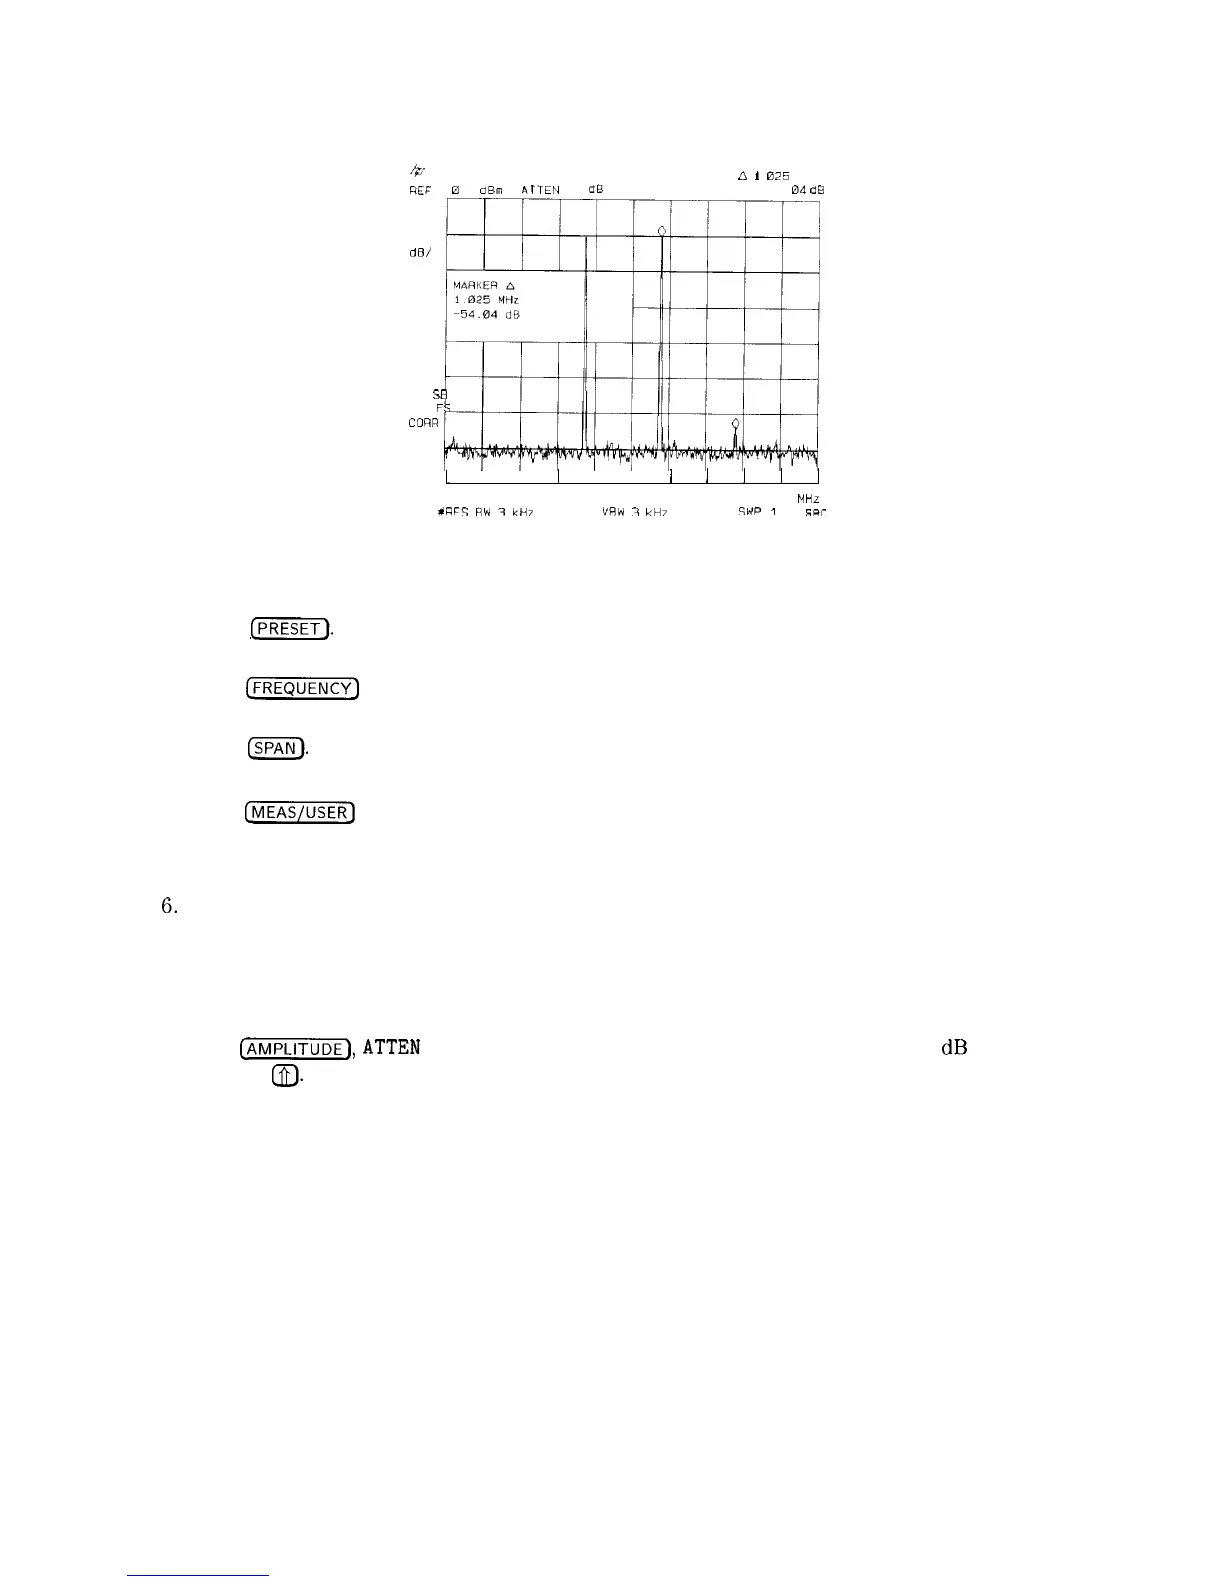
Figure 4-36. Third-Order Intermodulation Measurement
Example: Use the TO1 function to make a measurement
1. Press
~%iSQ.
Connect two equal amplitude signals with different frequencies, to the
spectrum analyzer INPUT 500.
2. Press
@Z?jKK7]
and enter the frequency of one of your input signals to place the signal at
the spectrum-analyzer center frequency.
3. Press
(SPAN_).
Change the span until only the two signals and their two distortion products
appear on the display.
4. Press
(-1
and TO1 ON OFF (ON) to activate the third order intercept measurement
function.
5. Read the measurement results in the upper left corner of the screen.
6.
Press TO1 ON OFF (OFF) to turn the measurement off,
It is important to verify that the TO1 being measured is coming from the device under test and
not from the spectrum analyzer. An easy way to do this is as follows:
1. Set up the TO1 measurement and turn it on.
2. Press
(mj,
ATTEN
AUTO MAN (AUTO) and increase the attenuation + 10
dB
by
pressing
@).
3. If the displayed result of the TO1 measurement remains constant, then the value is the result
of the device under test.
4. If the displayed result of the TO1 measurement decreases, then the value is due to spectrum
analyzer distortion and not the device under test. In this case, continue to increase the
attenuator setting until the measurement result no longer changes as the attenuator is
changed. When the value remains constant, the result is from the device under test.
Increasing the attenuator setting of the spectrum analyzer decreases the level of the signal
internal to the spectrum analyzer and therefore decreases the distortion generated by the
analyzer. Refer to the characteristics information in specifications and characteristics in your
calibration guide for a graph of the typical distortion performance of the spectrum analyzer.
4-42 Making Measurements

 Loading...


