&&
REFREF
dBm
ATTEN
10
d8
PEAKPEAK
LOGLOG
10
dB/dB/
/
WA
SB
WA
SB
SC FCSC FC
CORRCORR
1
CENTER
900
MHZ
CENTER
900
MHZ
SPAN
1
SPAN
1
800
GHr
800
GHr
RES
BW
3
MHZ
RES
BW
3
MHZ “BW“BW
1
MHZ
1
MHZ SWPSWP
20
msec
20
msec
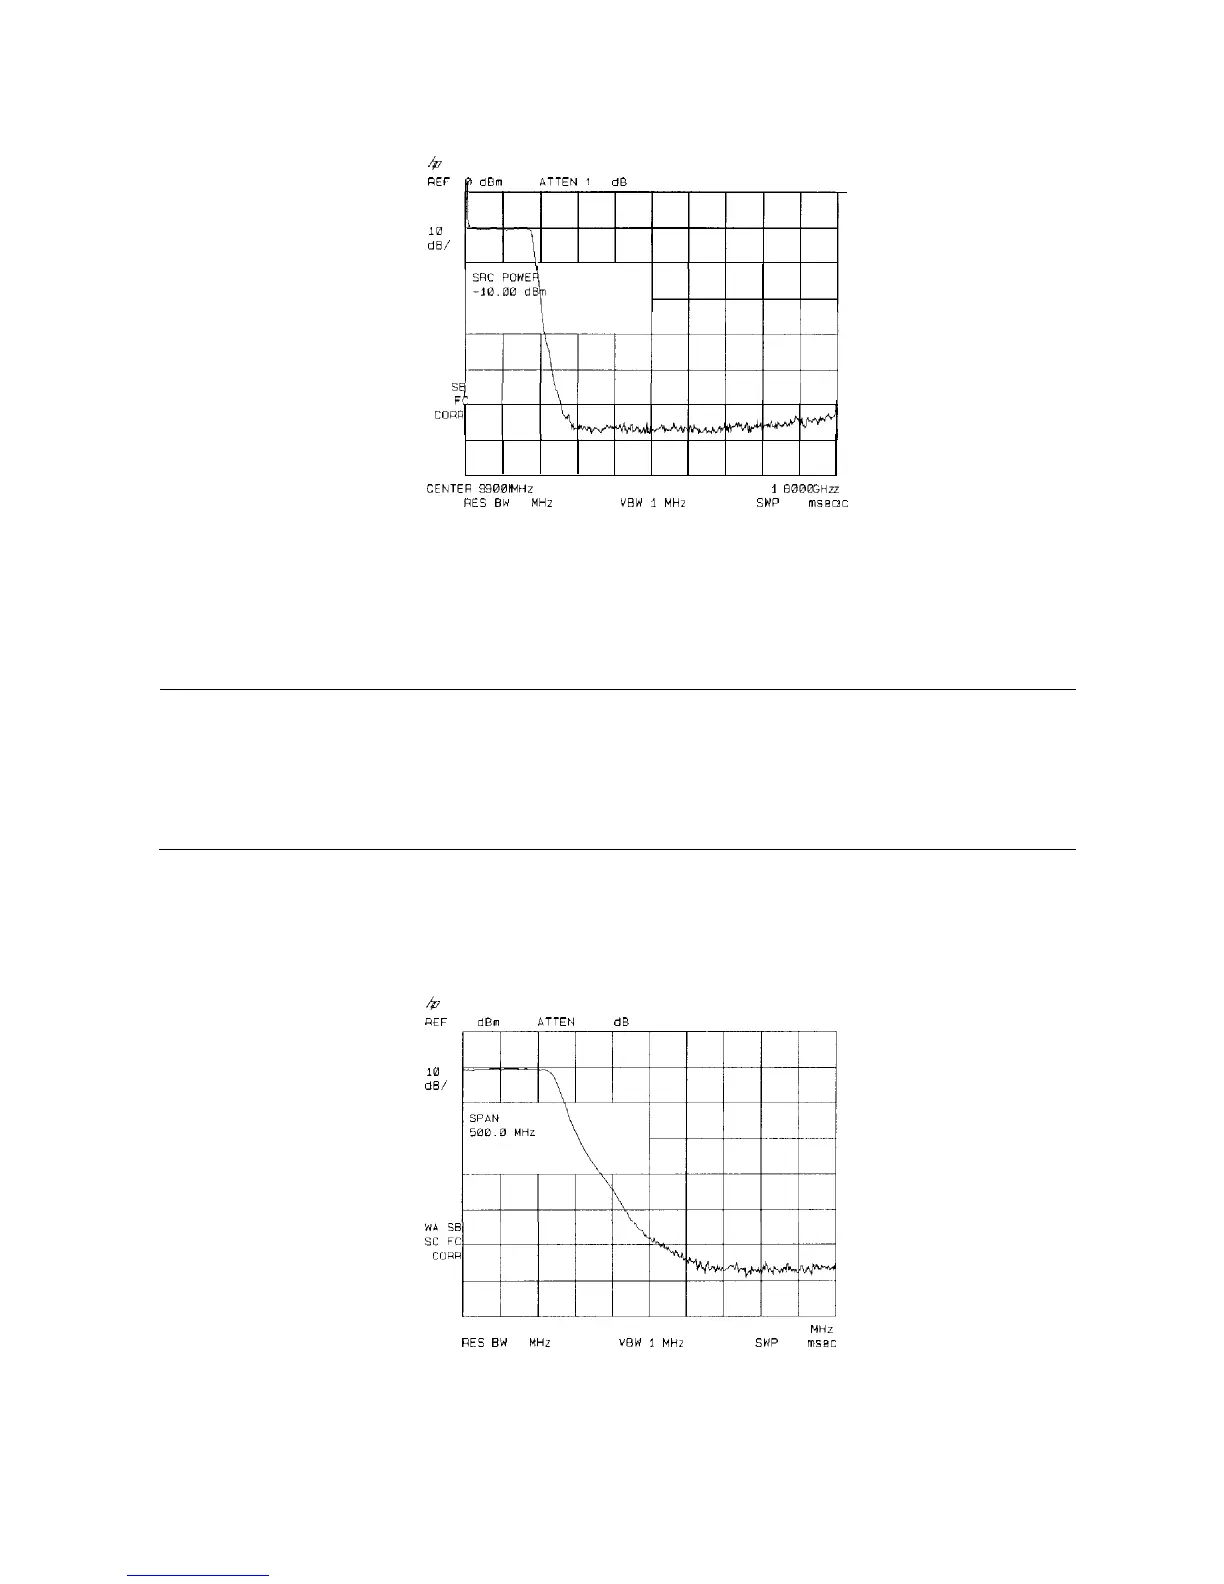
Figure 4-5. Tracking-Generator Output Power Activated
4. Put the sweep time of the analyzer into stimulus-response auto-coupled mode by pressing
More 1 of 2 , then SWP CPLG SR SA until SR (stimulus-response mode) is underlined.
Auto-coupled sweep times are usually much faster for swept-response measurements than
they are for spectrum analyzer measurements.
Note
In the stimulus-response mode, the Q (reactance versus resistance) of the
DUT can determine the fastest rate at which the spectrum analyzer can be
swept. To determine whether the analyzer is sweeping too fast, slow the
sweep time and note whether there is a frequency or amplitude shift of the
trace. Continue to slow the sweep time until there is no longer a frequency or
amplitude shift.
5. Since we are only interested in the rejection of the low-pass filter, tune the spectrum
analyzer center frequency so that the roll-off of the filter comprises the majority of the trace
on the display (see Figure 4-6).
ik
FIEF
0
dBm
ATTEN
10
dB
PEAKPEAK
LOGLOG
1818
dB/dB/
CENTER 443 6 MHZ SPAN 5061.0 MHz
FE5
BW
3
MHZ
vow
1
MHZ
SWP 20
msec
Figure 4-6. Spectrum Analyzer Settings According to the Measurement Requirement
Making Measurements 4-9

 Loading...


