Use the Peak
%ble
to List the Displayed Signals
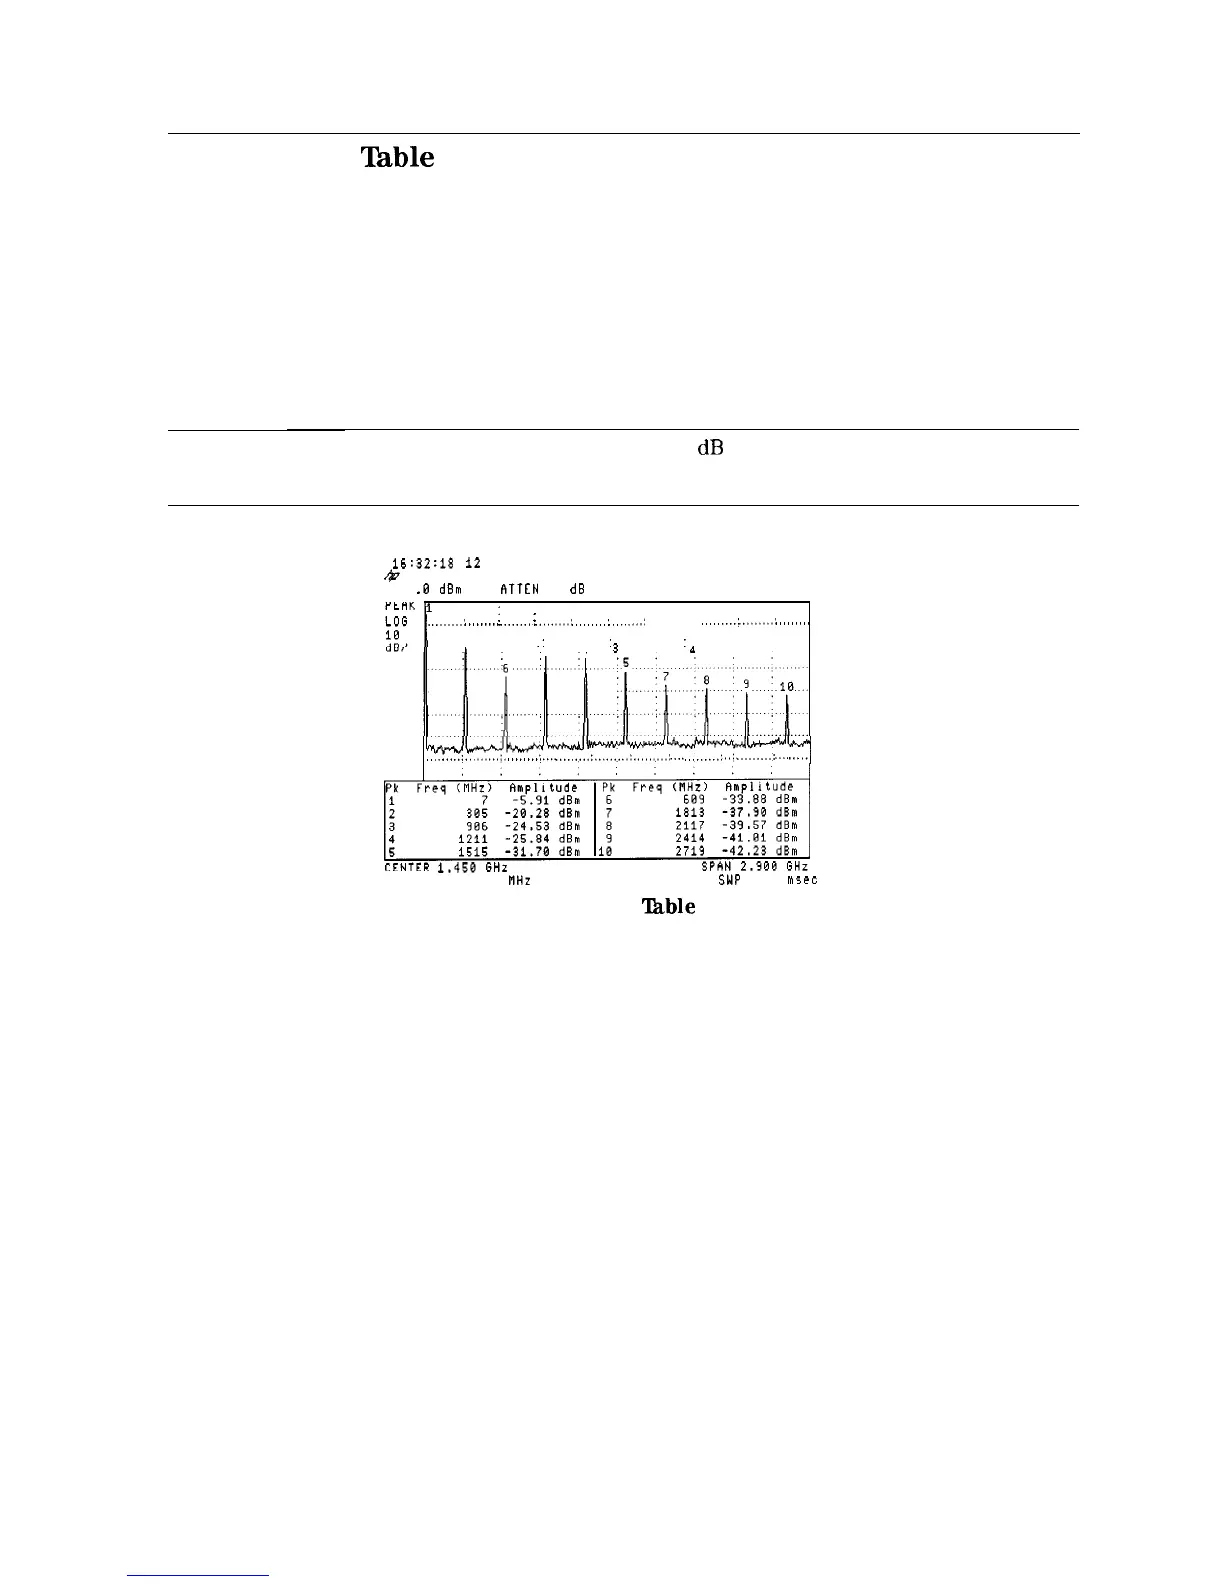
The peak table function can be used to list the amplitude and frequency of up to 10 of the
signals being displayed. This is done by pressing a single key, without having to put a marker
on each signal. Multiple signals from components, such as oscillators and mixers, or from
surveillance are automatically identified and listed. The information is updated at the end of
each sweep. The peak table display can easily be copied to a printer.
It is often helpful to have the spectrum analyzer sort the signals. The peak table feature marks
and list the signals based on the criteria selected. The signals can be sorted by increasing
frequency or decreasing amplitude. The peak table function can be set to select all of the
displayed signals, or only those signals above or below a specified display line.
Note
A signal must have a peak of at least 6
dB
to be recognized by the peak table
function. This value can be changed using the peak excursion function.
16:32:18
12
MAR 1992
&
REF
.B
dBm
RTTEN
18
dB
.
...,,,,,:
,.,....,,
i
,,,,,,,,,
i
,I,,.,,,,:
,,,,,,,,,:
,,,..,,,,:
. . . . . . . . . .
,,,,,....I
..,,I,,,,:
,,,,,,,,,
2
,
:
'3
'1
Iww,~~~www-y
.I.
,...,...:
.1.......,.,......,,..,,,,,,,:
,,,,,,,..:
.,,,,..,,:
..I..
n;
CENTER
1.456
GHz
RES BW 3.8 MHz
VBW 1 MHz
SWP 58.8 M5ec
RL
Figure 5-2. Peak
‘Ihble
Display
5-4 Using Analyzer Features

 Loading...


