Note
If the automatic tracking routine is activated in a narrow resolution bandwidth,
it usually is not necessary to use the tracking adjust again when increasing the
resolution bandwidth.
7. To make a transmission measurement accurately, the frequency response of the test system
must be known. To measure the frequency response of the test system, connect the cable
(but not the DUT) from the tracking generator output to the spectrum analyzer input. Press
Cm],
TRACE A
B
C (so B is underlined), CLEAR WRITE B , BLANK B . The frequency
response of the test system is now stored in trace B.
8.
To normalize, reconnect the DUT to the spectrum analyzer. Press
(TRACE],
More 1 of 3 ,
NORMLIZE ON OFF until ON is underlined. Press NORMLIZE POSITION to activate the
display line. This display line marks the normalized reference position, or the position
where 0
dB
insertion loss (transmission measurements) or 0
dB
return loss (reflection
measurements) will normally reside. Using the knob results in a change in the position of
the normalized trace, within the range of the graticule.
Normalization eliminates the frequency response error of the test system. When
normalization is on, trace math is being performed on the active trace. The trace math
performed is trace A minus trace B plus the display line, with the result placed into trace
A. Remember that trace A contained the measurement trace, trace B contained the stored
calibration trace, and DL (display line) represents the normalized reference position. Note
that the units of the reference level,
dB,
reflect this relative measurement.
b
REF
e
PEAK
LOG
10
dB/
DL
-6
6
dB
1
dBm
ATTEN
10 dB
I
I
I
I I I
I
I I
I
i
DISPLAY LINE
-6
6 dB
CENTER 443 6 MHz SPAN
500.0
MHz
#RES
BW
10
kHz
VQW
10
kHz
SWP
50
nlsec
Figure 4-9. Normalized Trace
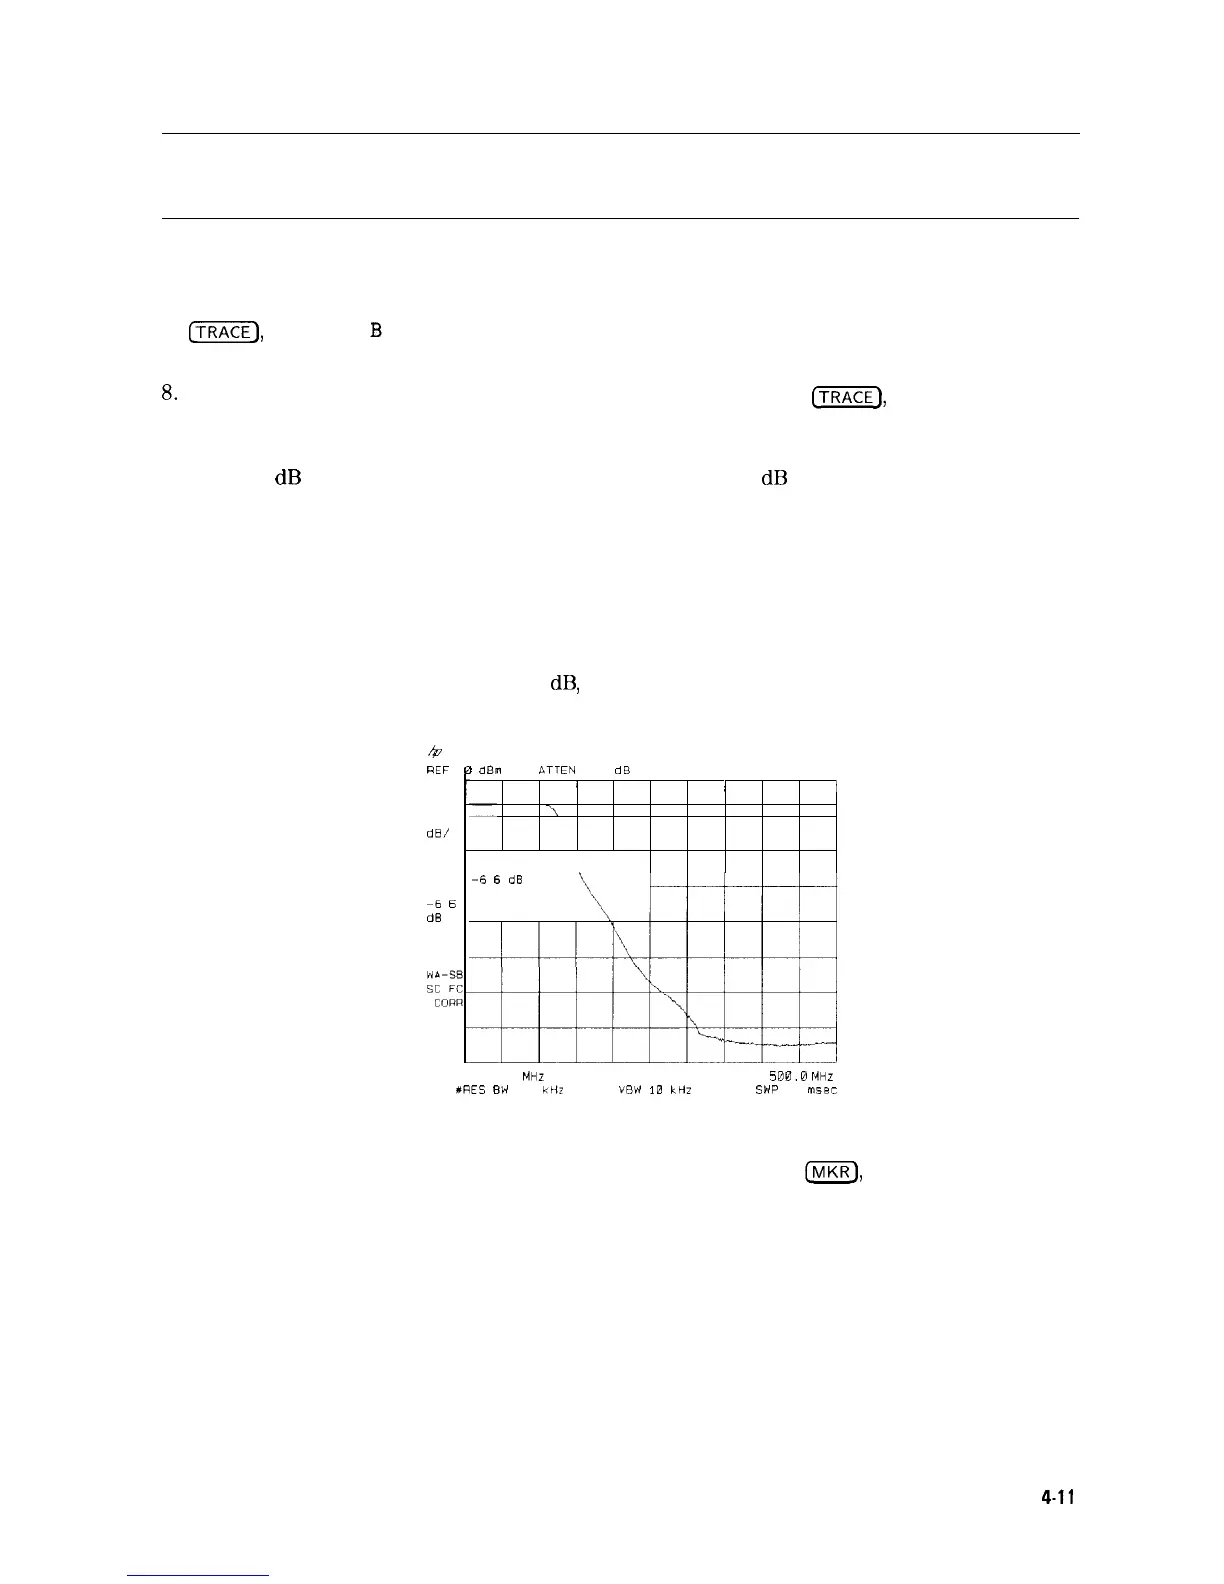
9. To measure the rejection of the filter at a given frequency, press
Ir\nKRl,
and enter the
frequency. For example, enter 350 MHz. The marker readout displays the rejection of the
filter at 350 MHz (see Figure 4-10).
Making Measurements
4-11

 Loading...


