5.
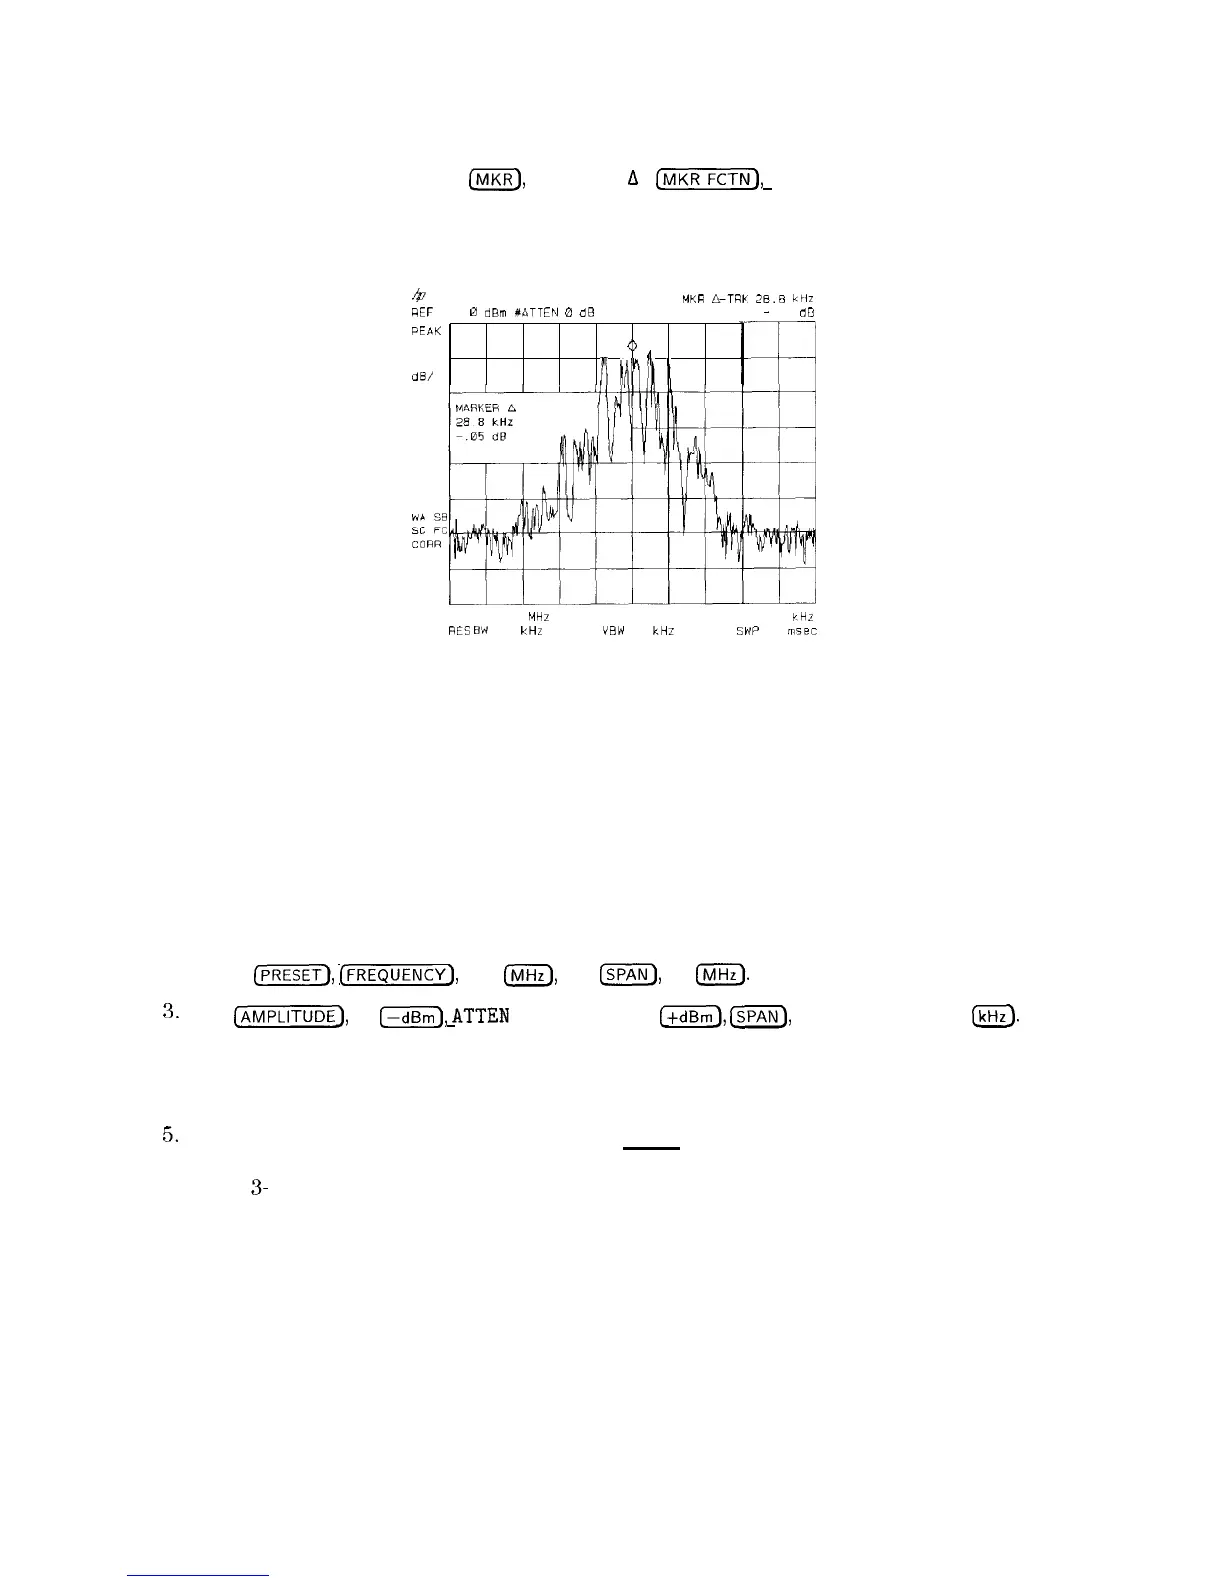
The signal frequency drift can be read from the screen if both the marker track and marker
delta functions are active. Press
INIKR),
MARKER
A
,
Cm),
MK TRACK ON OFF ; the
marker readout indicates the change in frequency and amplitude as the signal drifts. See
Figure 3-9.
b
MKR
A-TRII
28.8
ktiz
REF -40 0
dBm
#ATTEN 0
dB
-
05 dB
PEAK
LOG
0
10
I
d
dB/
1
k/Afi:
I
CENTER 104 9275
MHZ
RES ew 10
CHZ
SPAN 500.0
I-Hz
“BW
10
kHZ
SWP
30
m5ec
Figure 3-9. Using Marker Tracking to Track an Unstable Signal
The spectrum analyzer can measure the short- and long-term stability of a source. The
maximum amplitude level and the frequency drift of an input signal trace can be displayed and
held by using the maximum-hold function. The minimum amplitude level can be displayed by
using minimum hold (available for trace C only).
You can use the maximum-hold and minimum-hold functions if, for example, you want to
determine how much of the frequency spectrum an FM signal occupies.
Example: Using the maximum-hold and minimum hold functions, monitor the envelopes of a
signal.
1. Connect an antenna to the spectrum analyzer input.
2. Press
CPRESET_),
[FREQUENCY],
100
m,
and
m,
20
IMHz).
3.
Press
[AMPLITUDE_),
40
I-),
ATTEN
AUTO MAN , 0
(+dBm),
m),
SPAN ZOOM , 500
@.
Notice that the signal has been held in the center of the display.
4. Turn off the marker track function by pressing MK TRACK ON OFF (OFF).,
5.
To measure the excursion of the signal, press [TRACE) then MAX HOLD A . As the signal
varies, maximum hold maintains the maximum responses of the input signal, as shown in
Figure
3-
10.
3.10 Making Basic Measurements

 Loading...


