Learn About the Windows Display
The windows display feature is only available on the HP 85913, HP 85933, HP 85943,
HP 85953, and HP 85963. Windows display mode splits the spectrum analyzer display into two
frequency or time displays.
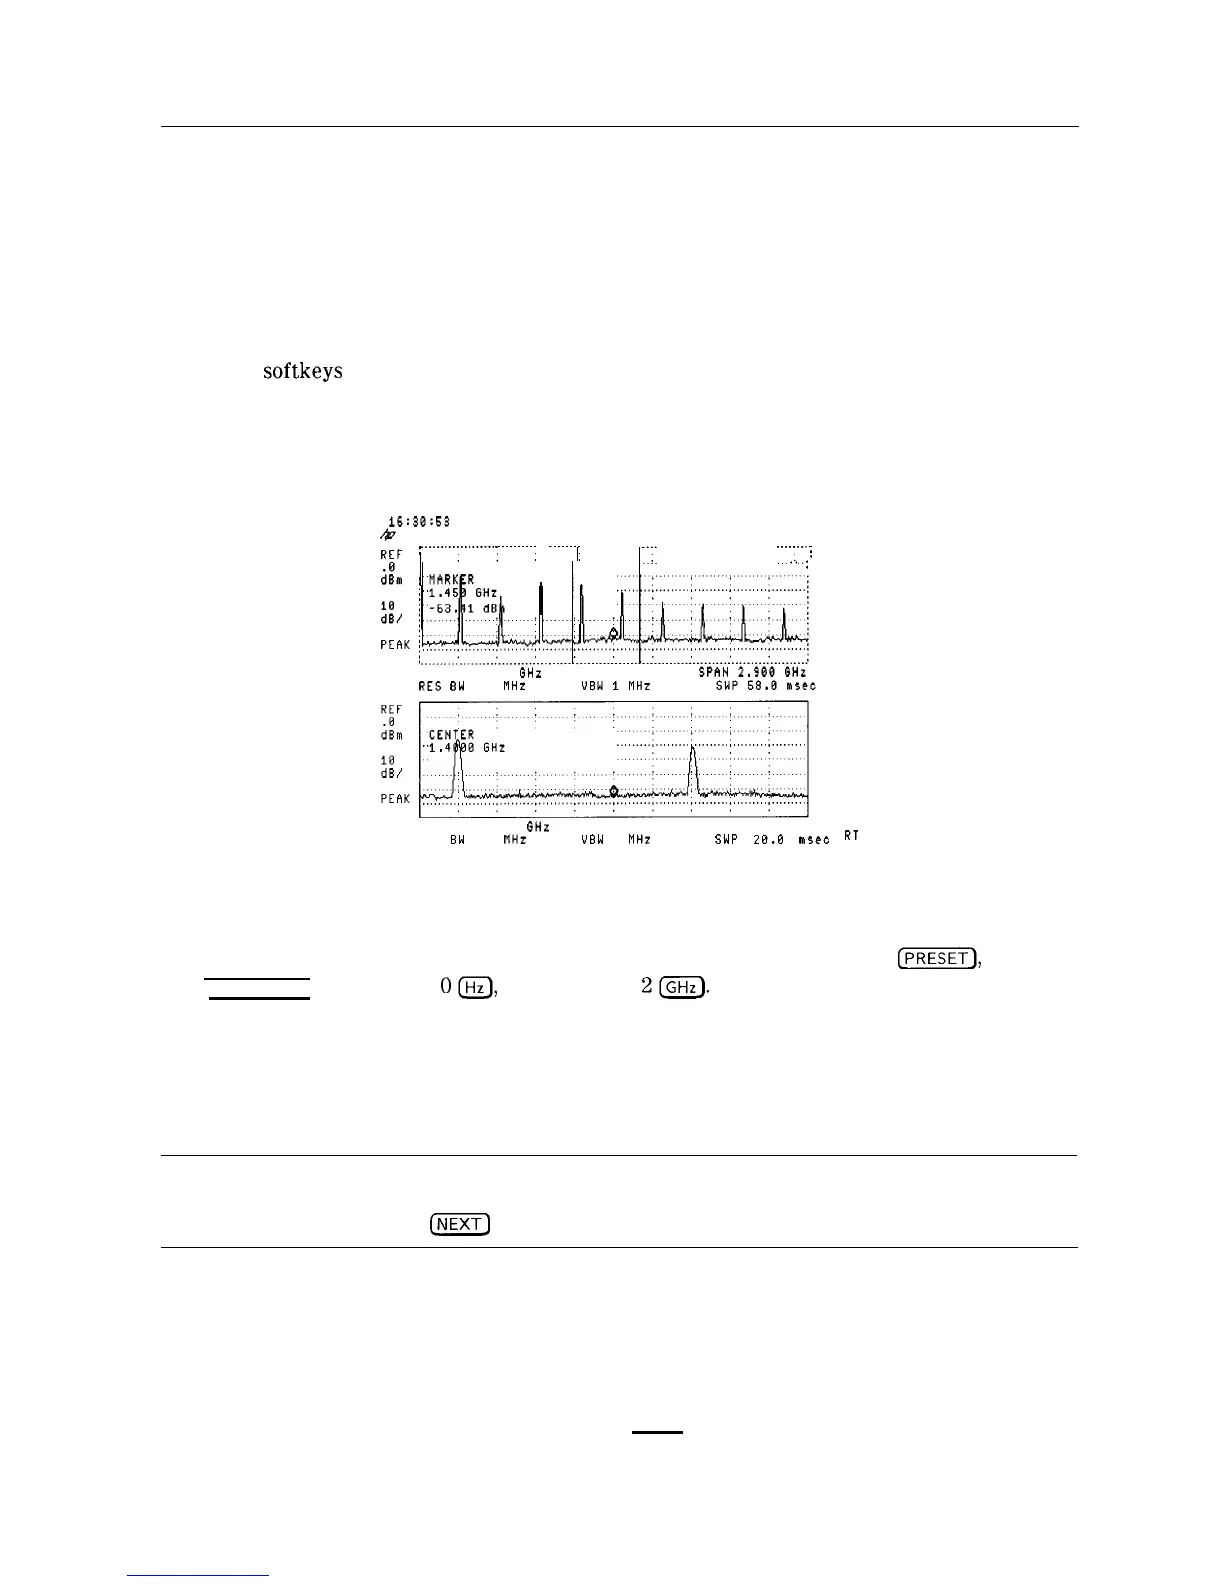
When windows is first turned on, the top window will contain an inactive copy of the previous
display. The lower window will be active and will display a subset of the frequency span of the
upper window. The span of the lower window will be indicated on the upper window by two
vertical lines called zone markers. The zone markers can be moved using the zone center and
zone span
softkeys
to look at different portions of the upper window span.
The instrument state of the active window can be changed without affecting the state of the
inactive window. The state of the active window will be used as the state of the spectrum
analyzer for sweeping and updating trace data.
16:30:53
12 MAR 1992
&
REF
:
______.__~______.__
I
._._.....:
. .
.._.....
. . . . . . . . . .
.'l: . . . . . . . . . . . . . . . . . . . :..:;.::
i
"
:
CENTER 1.450 GHz
RES
GW
3.8 MHZ
CENTER 1.4000 GHz
SPAN 500.0 MHz
RES
BW
3.8 VHz UBW 1 MHz
SWP 28.8 msec
R'
Figure 5-10. Windows Display Mode
Example: Use the windows display format to view the calibrator signal.
1. Connect the CAL OUT signal to the spectrum analyzer INPUT 500. Press
(M),
[FREQUENCY), START FREQ
O$J,
STOP FREQ
2m.
2. Turn on the windows display by pressing the WINDOWS (ON) key. The active window is
indicated by a solid line around the display, rather than a broken line. Press ZONE CENTER
use the knob or step keys to move the zone to include one of the harmonics. Notice that
the span marked by the zone markers in the upper window is shown as a full display in the
lower window.
Note
The upper window is not active so the trace is not updated, though the
zone position is updated. The upper window must be activated by pressing
WINDOWS
m
to update the trace data.
3. Press ZONE PK RIGHT . The spectrum analyzer identifies the first signal to the right of the
zone and moves the zone so that it is centered around the new signal.
4. Press ZONE SPAN and use the knob, step keys, or the data entry keys to change the zone
span to include two signals. If the lower window is active you will notice that the span
changes corresponding to the changes in the zone marked on the upper window. (If the
lower window is not active press WINDOWS (NEXT) to make it active.)
Using Analyzer Features 5-33

 Loading...


