176 Events Tab
Monitoring Tab
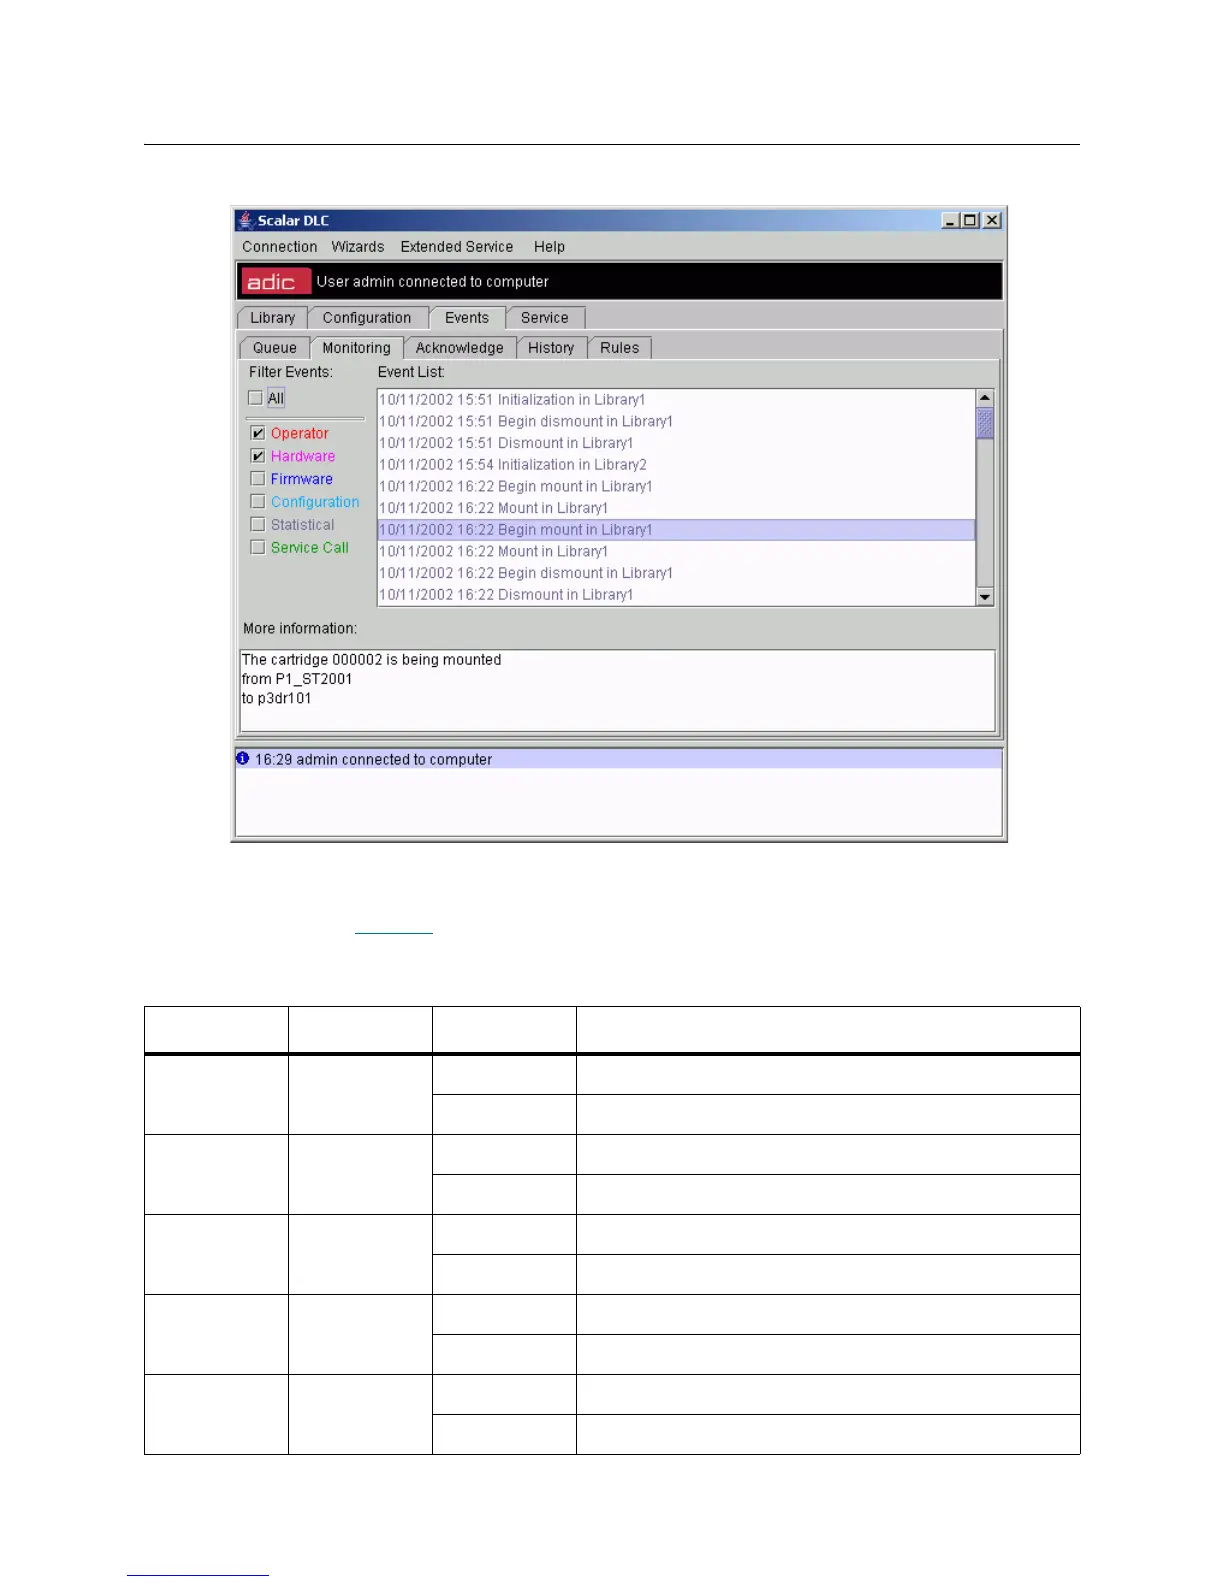
Figure 123 Monitoring Tab
The Monitoring Tab pane describes notifications that it receives during the current login session.
In the Filter Events area of the pane, there are seven predefined event classes. Each event class is shown
in a different color. See Table 24
.
Table 24 Event Classes
Event Class Color Checked Description
All Black Yes All received notifications are displayed.
No Only checked notifications are displayed.
Operator Red Yes Operator notifications are displayed.
No Operator notifications are not displayed.
Hardware Pink Yes Hardware notifications are displayed.
No Hardware notifications are not displayed.
Firmware Blue Yes Firmware notifications are displayed.
No Firmware notifications are not displayed.
Configuration Turquoise Yes Configuration notifications are displayed.
No Configuration notifications are not displayed.
 Loading...