27—UTILITY Menu Parameters
368 www.RolandUS.com Roland VS-2400CD Owner’s Manual
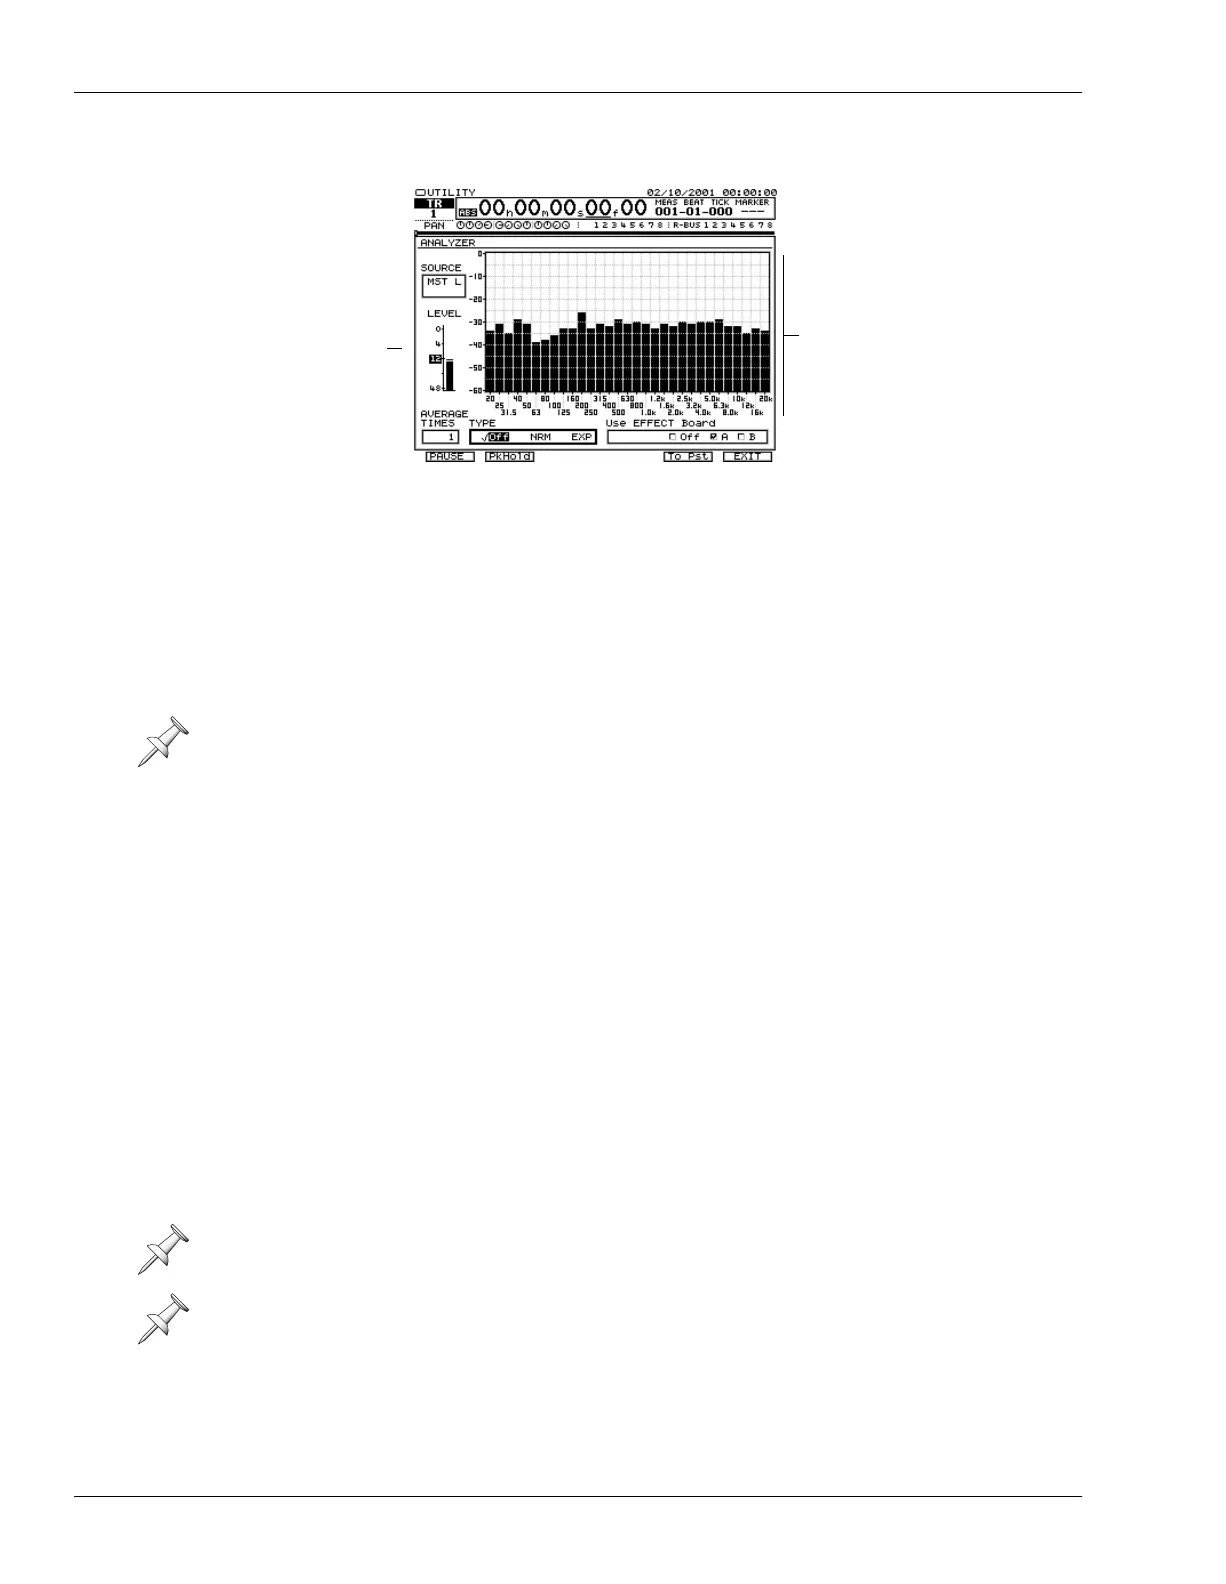
Analyzer
The analyzer performs a Fourier Fast Transform (FFT) analysis of a selected signal—the
result of the analysis is shown in realtime on the spectrum analysis display.
Powering the Spectrum Analysis Display
The spectrum analysis display requires one of the VS-2400CD’s VS8F-2 effect expansion
boards to operate. Select the Use EFFECT board parameter, and turn the Time/Value
dial to select the VS8F-2 you want to use. Press ENTER/YES to assign the effect board to
the spectrum analyzer display.
Understanding the Spectrum Analysis Display
Each frequency the spectrum analyzer displays is represented by a vertical bar on the
screen—the frequency each bar represents is shown beneath it. A bar shows how loud
its frequency is at the present moment in relation to the dB level scale shown up and
down the left edge of the analyzer. If a frequency is completely absent from a signal, its
bar doesn’t light.
Setting Up the Spectrum Analysis Display
Select the SOURCE parameter and turn the Time/Value dial to select the signal you
want to analyze. The analyzer works with any of the following mono signals:
• individual input and track channel signals
• the left or right side of the stereo FX return channel signals
• the generator/oscillator
• the left or right side of the stereo MASTER and MONITOR busses
• individual Aux bus and Direct path signals
When an effect board is being used by the spectrum analyzer display, it’s unavailable
for other use. For this reason, make sure to re-set Use EFFECT Board to Off—by
selecting Off and pressing ENTER/YES—when you’re done using the analyzer.
When input or track channels or Aux busses are linked, the spectrum analyzer looks at
each of the linked channels or busses individually.
The level meter at the left of the display shows the level of the signal being analyzed.
Spectrum analysis
display
Level
meter
VS2400OMUS.book 368 ページ 2006年2月28日 火曜日 午前11時12分
 Loading...