Using the M4 TORNADO Software
M4 TORNADO
109
6.9.3.5 False color display
This option allows the display of element maps in false color presentation for the selected
elements. The false color will be calculated from the sum intensities of the selected elements. The
sensitivity of color selection can be adjusted.
The false color presentation offers a better separation of sample areas with different composition.
Table 38 False color display
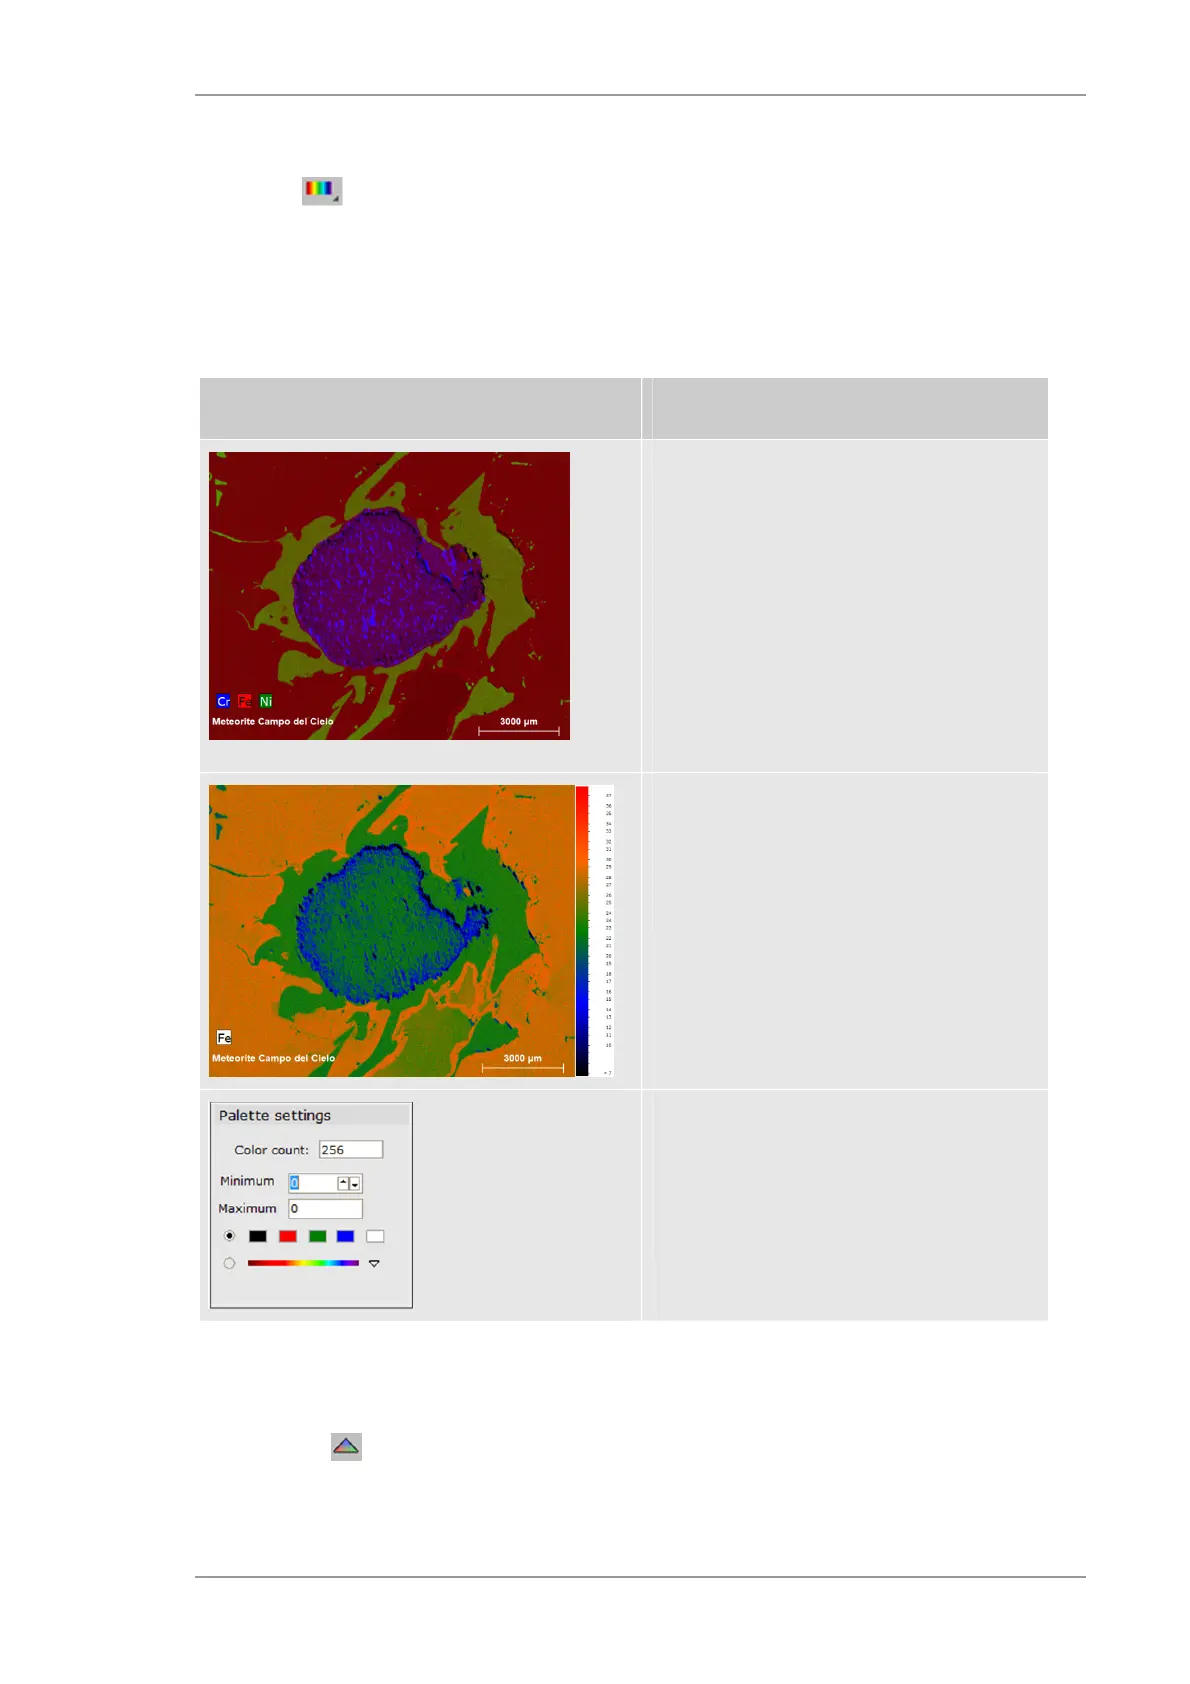
Object Description
Display of element distribution
Elements or regions of interest (free regions)
identified in the spectrum can be selected
from the thumbnail list at the bottom and
displayed as single or multiple element
distribution. Each with one colour, were
saturation correlate with intensity of the
signal.
Brightness and saturation can be set with the
scroll bars below the image
False colour display showing the distribution
for the selected element.
Sensitivity and saturation can be set with the
scroll bars.
Opens with the right hand mouse button on
the false color display and allows settings for:
the color ranges and
the type of color changes (separated or
continuous color changes)
6.9.3.6 Element chart
Element chart intensity diagrams for every element and binary and ternary diagrams can be
opened by the icon and allow a few simple chemometric evaluations.
 Loading...


