Functional principles
M4 TORNADO
23
3.5 Composition of a Spectrum
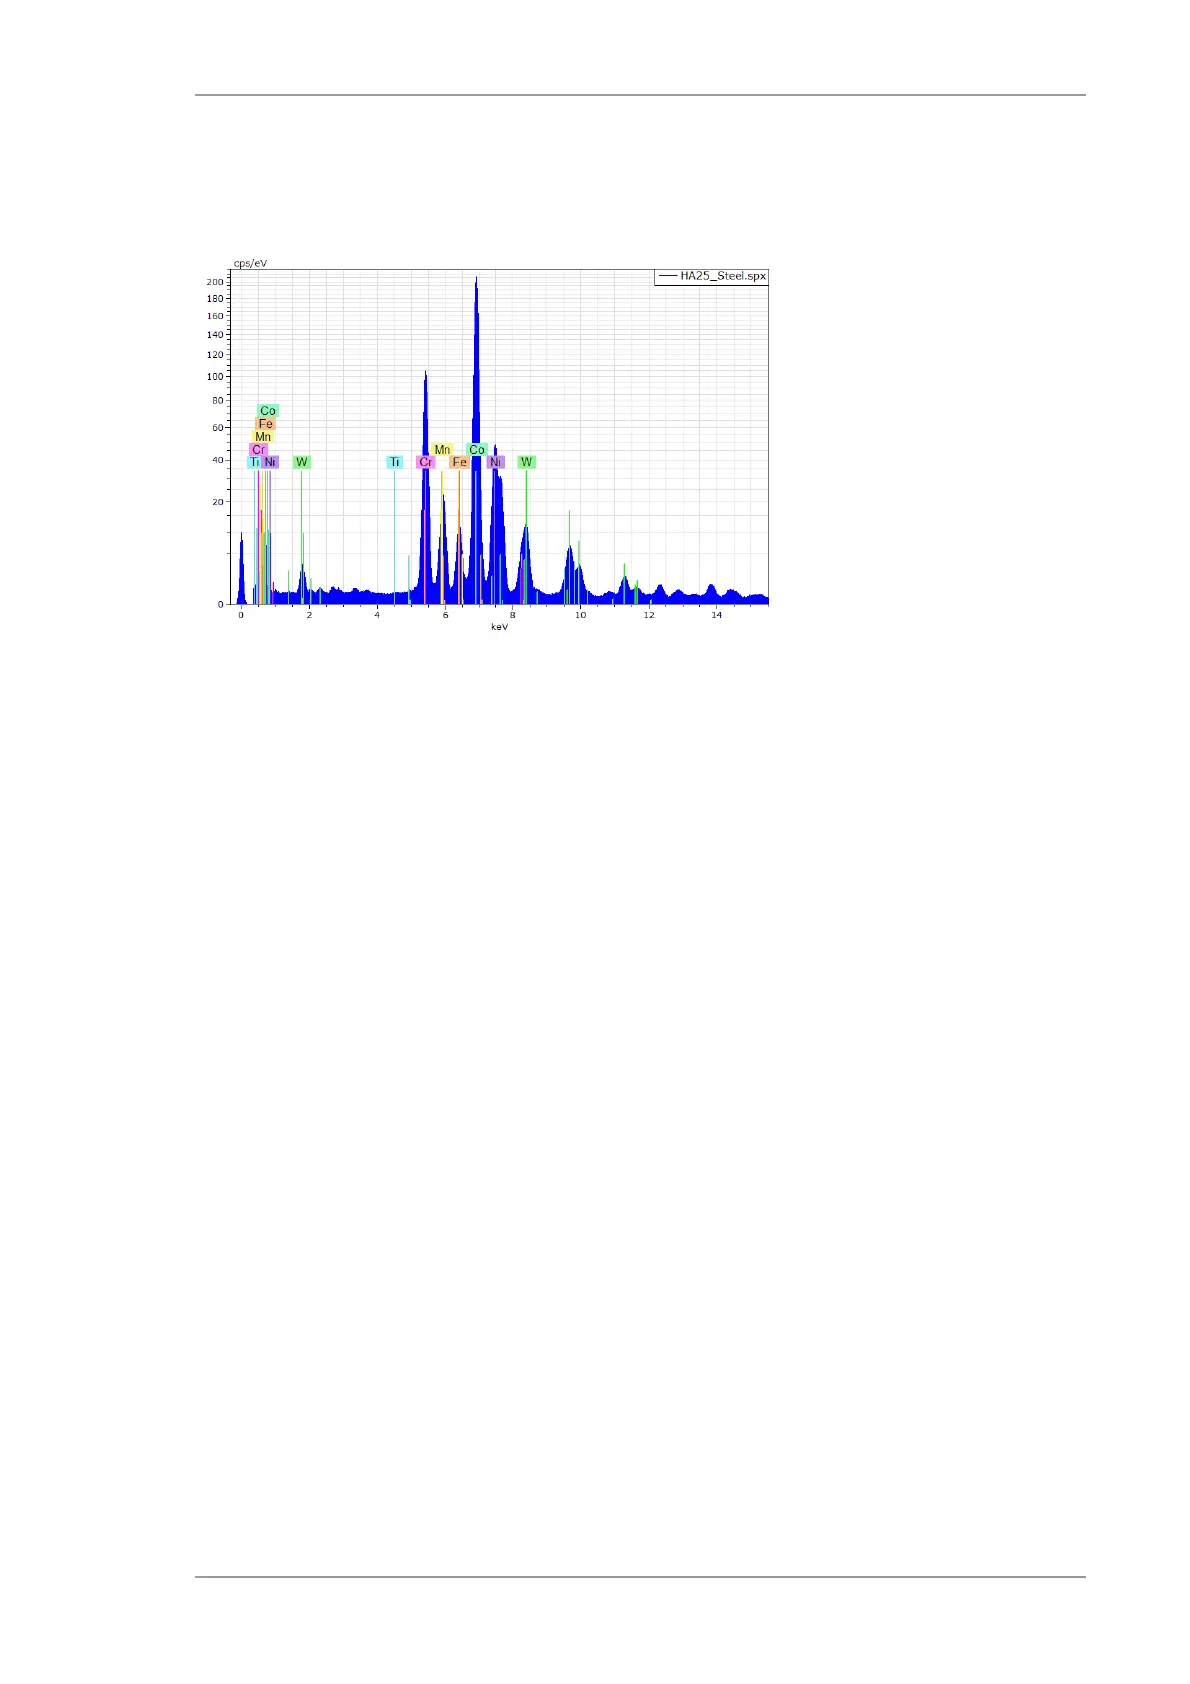
A steel spectrum is shown in Fig. 5.
Fig. 5 Typical composition of an XRF spectrum
The spectrum shows the following features:
Abscissa in the measuring unit kiloelectron volts (keV) or in channel presentation after a shift
in the software
Fluorescence peaks of the elements Sn, V, Cr, Mn and Fe are displayed. These peaks are
emitted from the sample.
Artifact peaks like escape and pile up (see separate description in the reference manual
Physical Principles of Micro-XRF).
Peak at zero energy. The zero energy peak is not originated in the sample or the detector but
synthetically created by the electronics. It is mainly used for the control of the electronics and
for service tasks, in particular for energy calibration and live time calculation.
Ordinate in the measuring unit counts (pulses) or after switching into the measuring unit
counts per second (cps) in the software.
3.6 Evaluation of X-ray Fluorescence Spectra
The X-ray fluorescence analysis is intended to solve two partial tasks. Which elements are
present in the sample and what is the concentration of them within the complete sample amount?
This is commonly called element identification and element quantification. Often, the
measurement task is just restricted to the identification of the elements.
Upon completion of the measurement, the spectrum itself is just a data set and not yet a result. It
is an iterative process of spectrum correction and evaluation that leads to the solution of an
analytical task. The different steps of a spectrum evaluation will be briefly described in Table 3.
 Loading...


