Quantification with M-Quant
156
User Manual
A Quantification with M-Quant
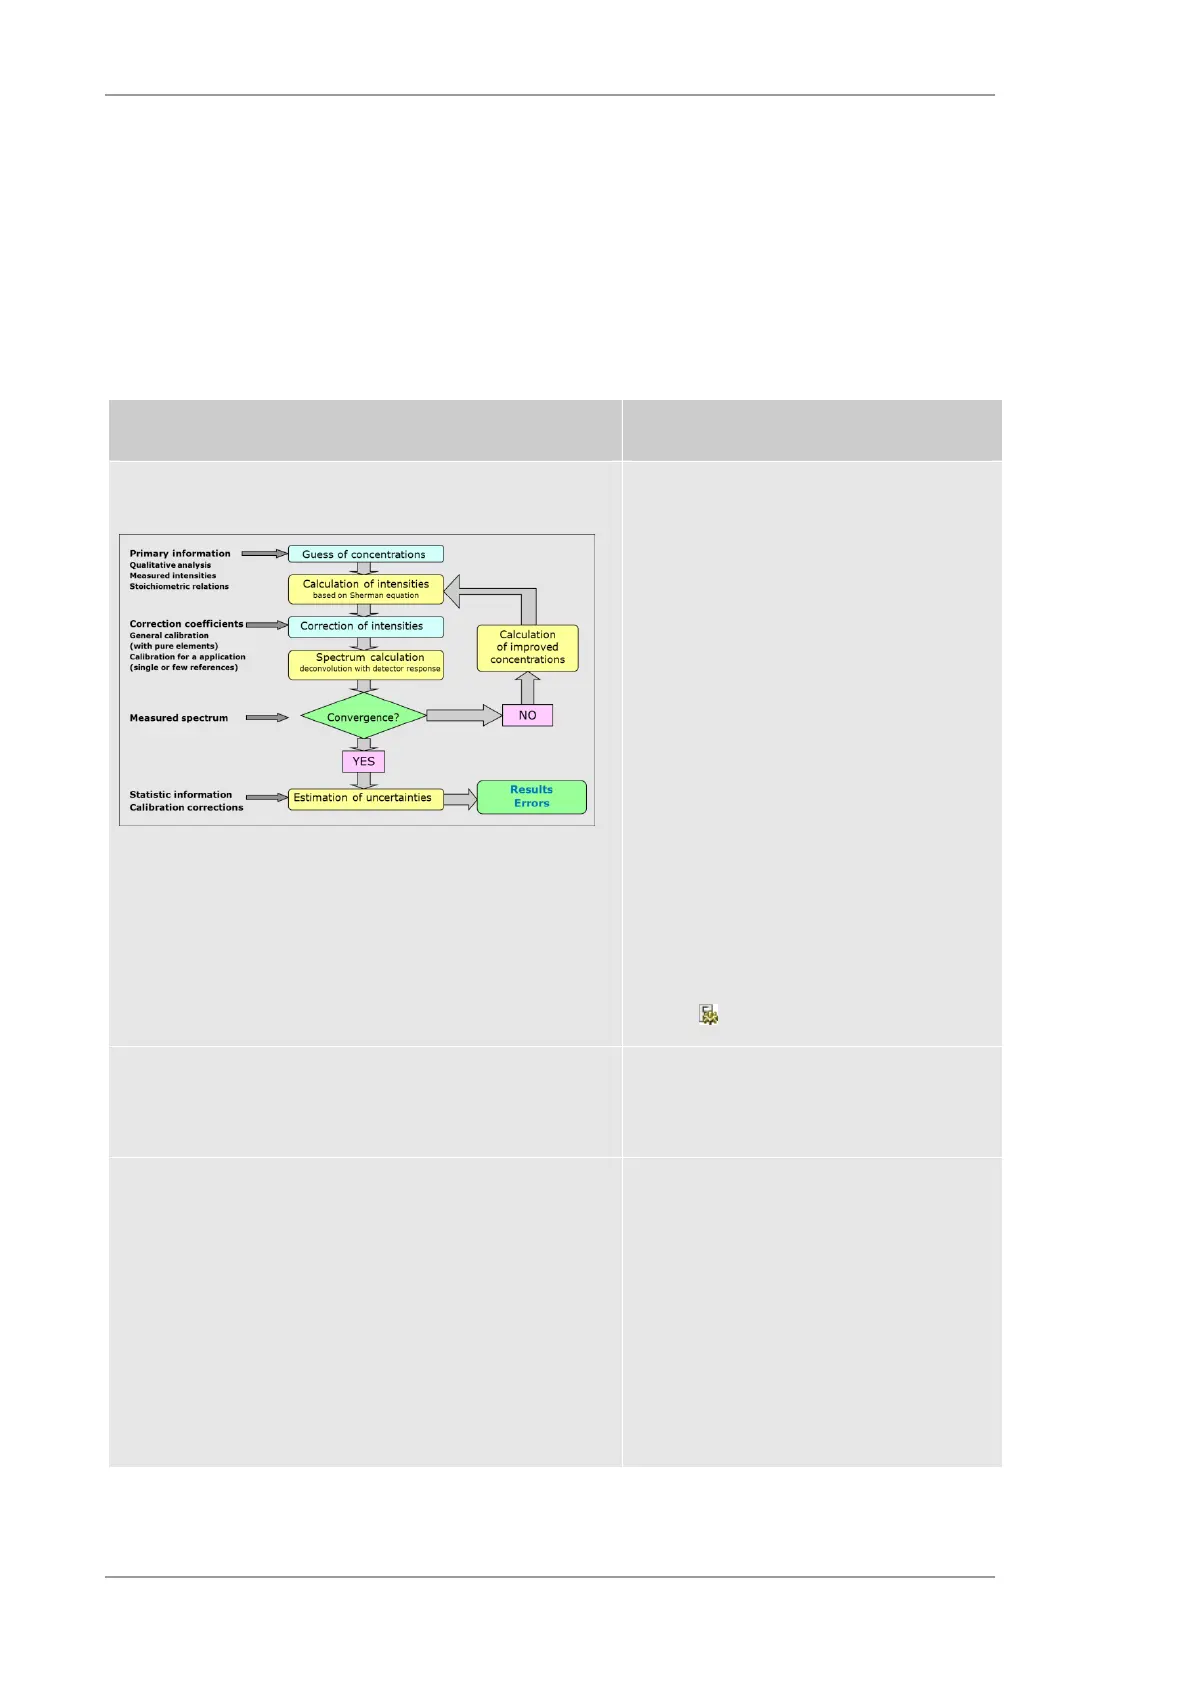
Quantitative analysis is performed by calculation of a theoretical spectrum with the Sherman
relation. This calculated spectrum is compared with the measured one and then the quantification
result is iteratively improved. The flow chart of this calculation is shown in Table 57 together with
the description of the steps of calculation.
Table 57 Steps for the calibration with MQuant
Step Description
Result calculation and display
Calculation of concentrations
The quantification is performed by
calculation the intensities for an artificial
sample with assumed concentrations. The
calculated spectrum is compared with the
measured one. By an iteratively procedure
the quantification result is improved.
The result panel provides various tools for
checking element identification, peak
deconvolution, and net peak area
estimation. Individual parts of a
reconstructed spectrum can be selected
for display and compared with the
acquired spectrum.
The result display is configured according
to the method settings. This default
settings can be overwritten within the
result options panel which can be opened
via icon .
Initial guess of concentrations The start values for the concentrations are
calculated based on the measured
intensities.
Calculation of intensities Element intensities in the spectrum are
calculated forward by solving the Sherman
relation. Fundamental parameters are
used from corresponding tables; the tube
radiation is calculated directly based on
models from Ebel
1)
taking the tube
geometry and tube parameters into
consideration. The transmission function
of the lens is approached by an
asymmetric Gaussian-function and
additionnally corrected with pure elements.
 Loading...


