4-1 2000-OSM, F1
SECTION 4. TECHNICAL DESCRIPTION
FUNCTIONAL DESCRIPTION
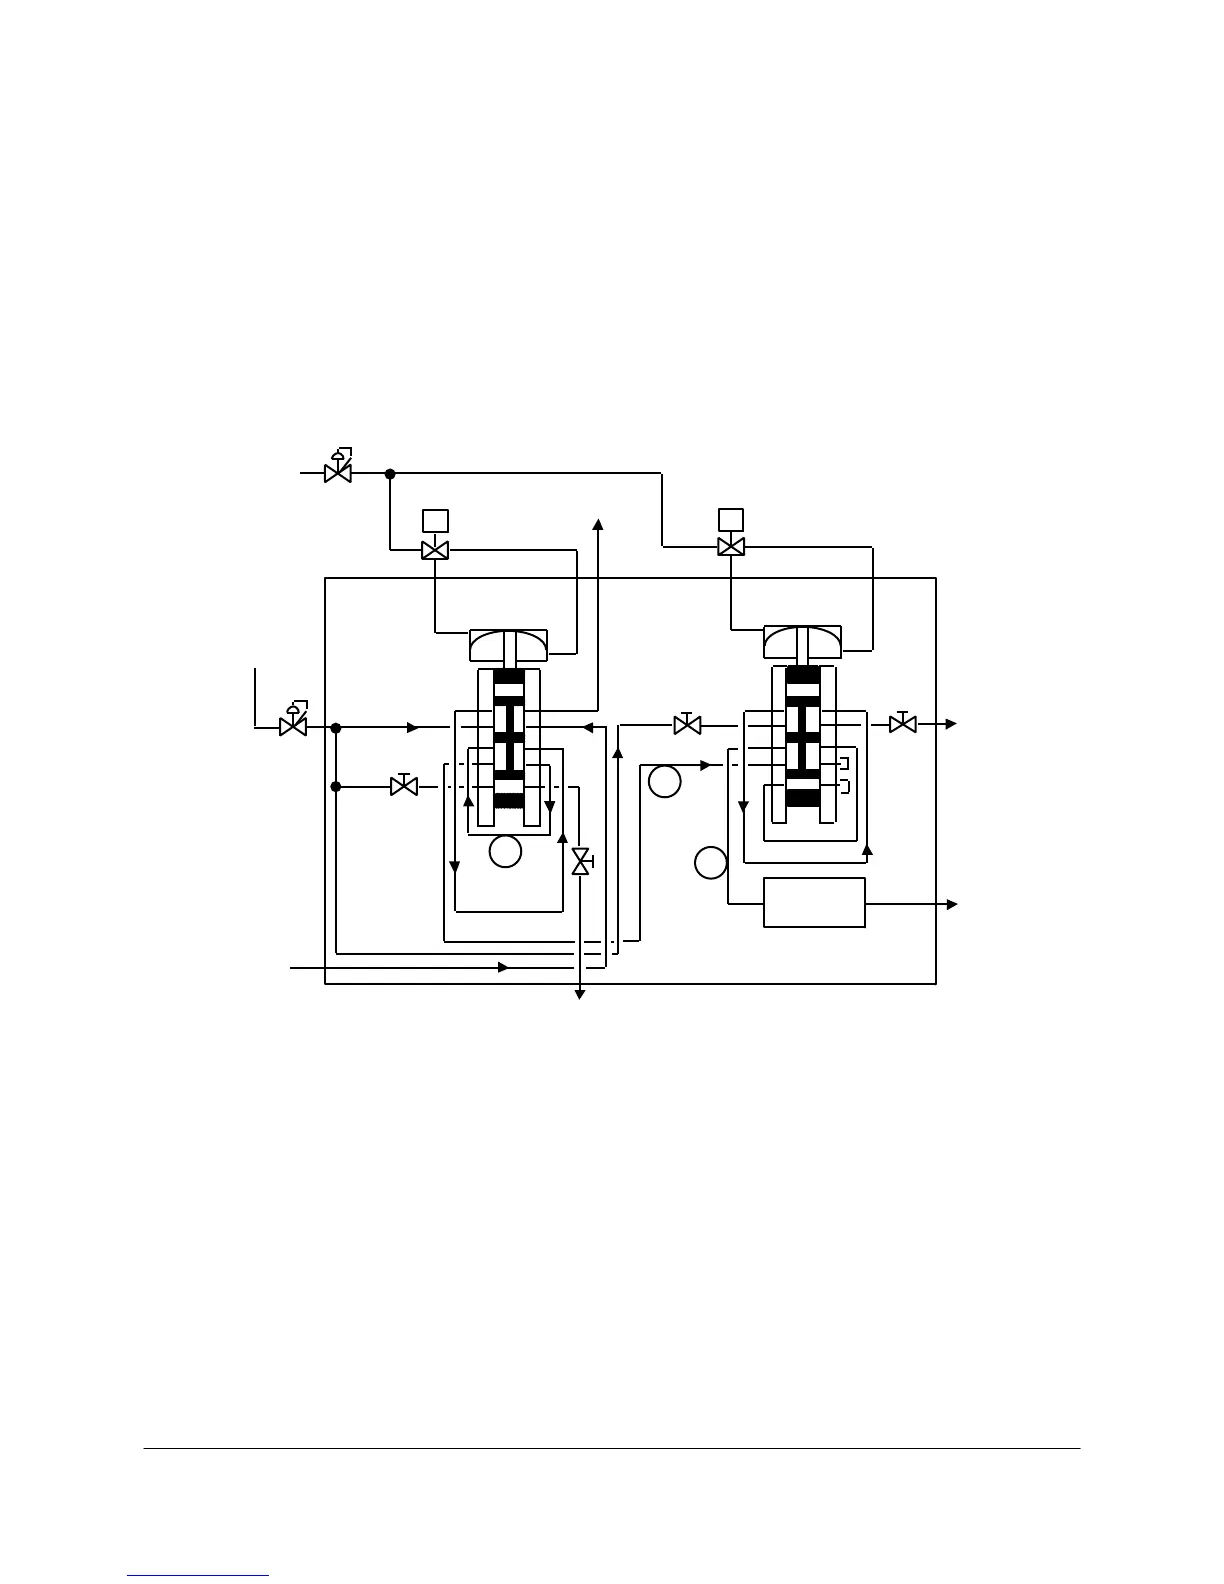
Figure 4-1 shows a typical analytical flow system, using the flame ionization detector for illustration.
Connections at the right side of the analyzer cabinet provide all gas and air inputs. Sliding plate
valves, liquid sample valves, or a combination of both, provide control and measurement of the
sample. Each analytical valve is air-actuated by an electrical solenoid valve, which in turn is
controlled by the Solenoid Driver PCB. An operational cycle for the valves consists of three modes:
sample purge, sample inject, and backflush. In the sample purge mode, sample flows through the
sample loop to vent. In the sample inject mode, the sample valve switches, capturing a plug of
sample which the carrier then sweeps through the column train to the detector. In the backflush
mode, the carrier backflushes Column 1 to vent.
ANALYTICAL
FLOW ADJ
BACKFLUSH
VENT
SAMPLE
IN
SAMPLE
VENT
COLUMN
2
SAMPLE LOOP
SELECTOR
FLOW ADJ
SELECTOR
VENT
CELL
VENT
DETECTOR
1
1
2
2
3
3
4
4
5
5
6
6
7
7
8
8
9
9
10
10
CARRIER
IN
SV
SV
SUPPLY
AIR
PURGE
AIR ADJ
OVEN
COLUMN
1
COLUMN
PRESSURE
ADJ
COLUMN
3
Figure 4-1. TYPICAL ANALYTICAL FLOW SYSTEM DIAGRAM
The sample valve captures a sample in the sample loop. When the valve switches, the carrier gas
sweeps a sample plug through the sample/backflush valve, through Column 1, to Column 2 and into
the detector cell, where it is converted to an electrical signal. Column 1 performs preliminary
separation to remove the heavier non-measured components, which are then backflushed to vent.
Column 2 separates the components to be measured, which elute sequentially. The electronic output
signal from the detector represents the component inputs proportionally.
The selector valve determines which components will be measured. The sample output from Column
2 goes through Column 3 to the detector for measurement. When the valve switches, the sample not
being measured is flushed through the Selector Vent.
 Loading...