5. The upper trackball key changes from position to size of the ROI and back.
6. Select the [Calculate] key on the menu area or press the right or left trackball key. The
histogram and corresponding number (left below the box) will be calculated and displayed.
Remarks:
•
Measuring, text annotation, bodymarks entering as well as all post-processing settings
are not possible in Histogram mode.
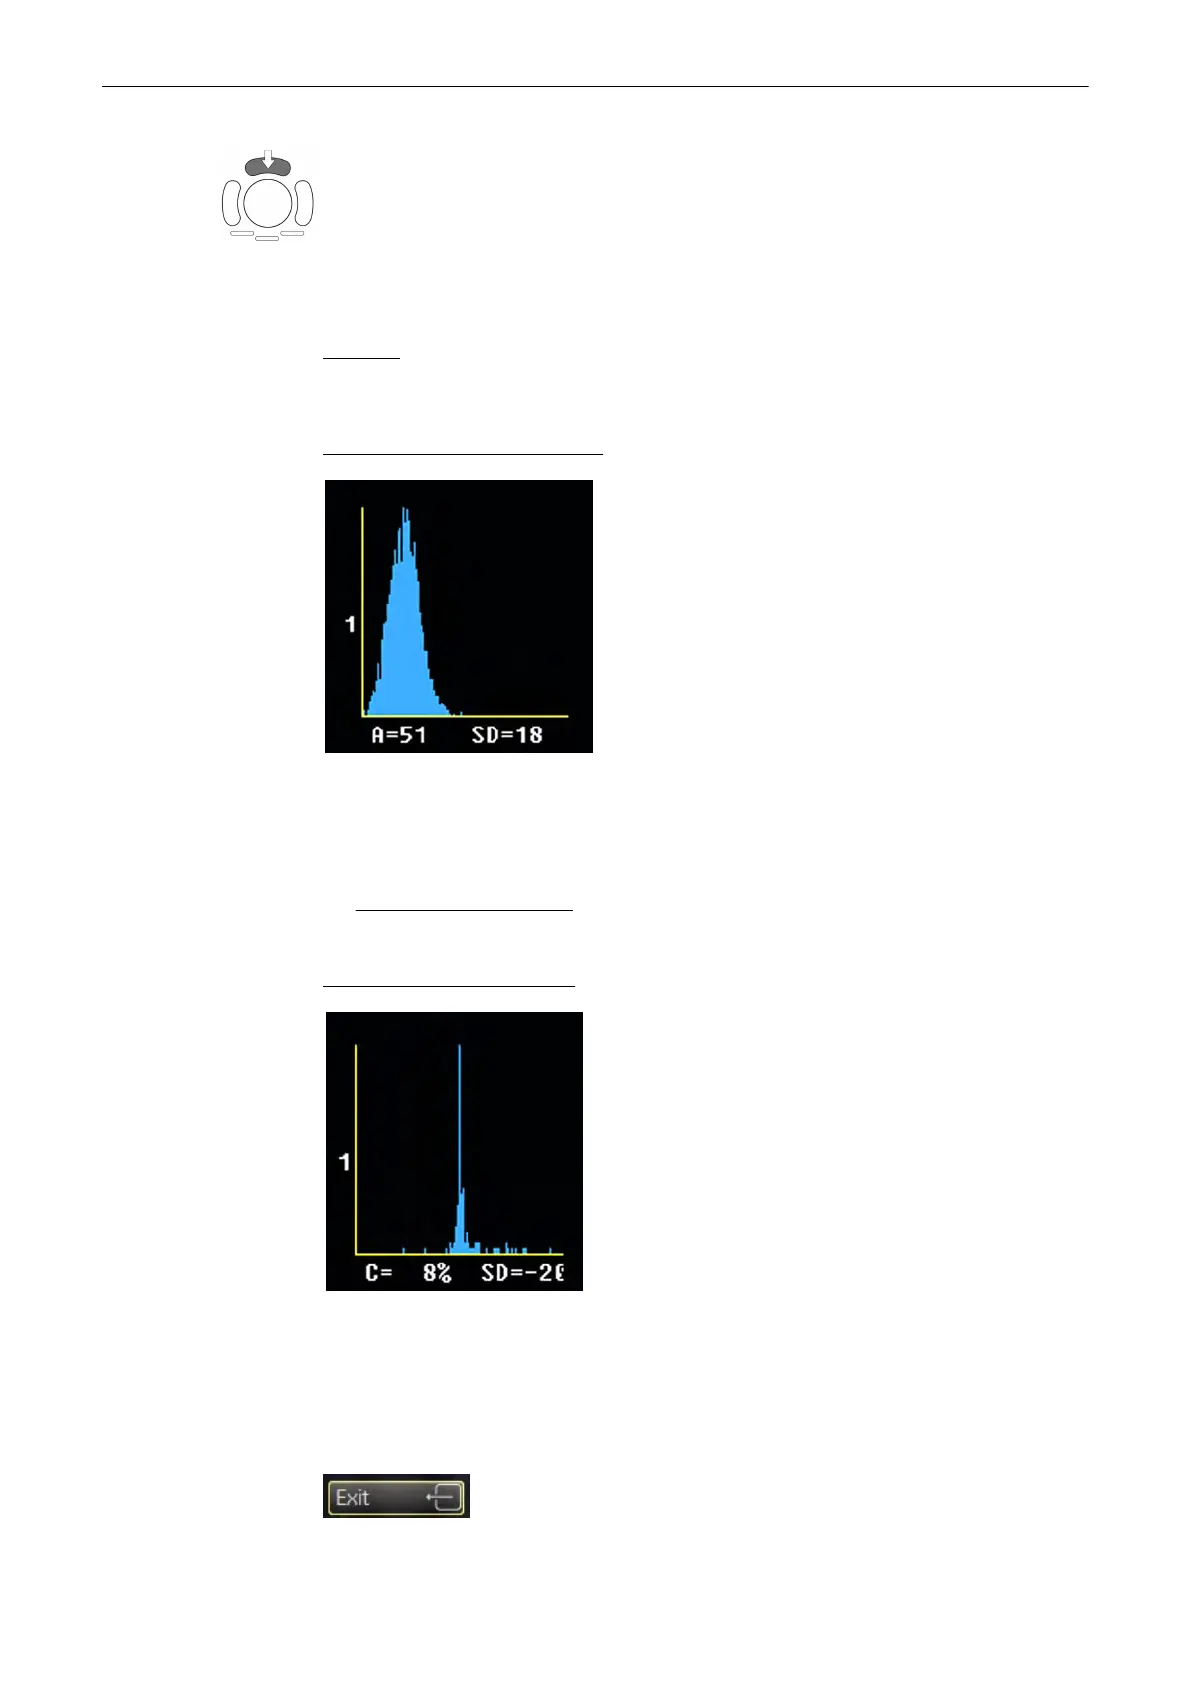
Display of gray scale HISTOGRAM
X-axis: grayscale values from 0 to 255
Y-axis: incidence in %, normalized to maximal incidence
A: Average value
A = Sum of [values x presence] Number of values in ROI
SD: Standard deviation
Display of a color HISTOGRAM
X-axis: color values acc. Color bar
Y-axis: incidence in %, normalized to maximal incidence
C: Color values in %
SD: Standard deviation
Utilities and System Setup
13-6
Voluson® S6/S8 Basic User Manual
5433669-100 Revision 4
 Loading...