19-2 Passport 12/Passport 8 Operator’s Manual
To browse the graphic trends, you can either:
Select or beside [Scroll] to move the cursor one step to the left or right to navigate through the
graphic trends, or
Select or to move the cursor one page to the left or right to navigate through the graphic
trends.
A time indicating your current position displays above the parameter area. Numeric measurement values
corresponding to the cursor location change as the cursor is moved. The measurement value that triggered a high
level alarm has a red background. The one that triggered a medium/low level alarm has a yellow background.
Select
or beside [Event] to position the cursor to a different event time.
Select the [Record] button to print the currently displayed graphic trends by the recorder.
Select the [Print] button to set and print the graphic trends report by the printer. For how to set the graphic trends
report, refer to chapter 22 Printing.
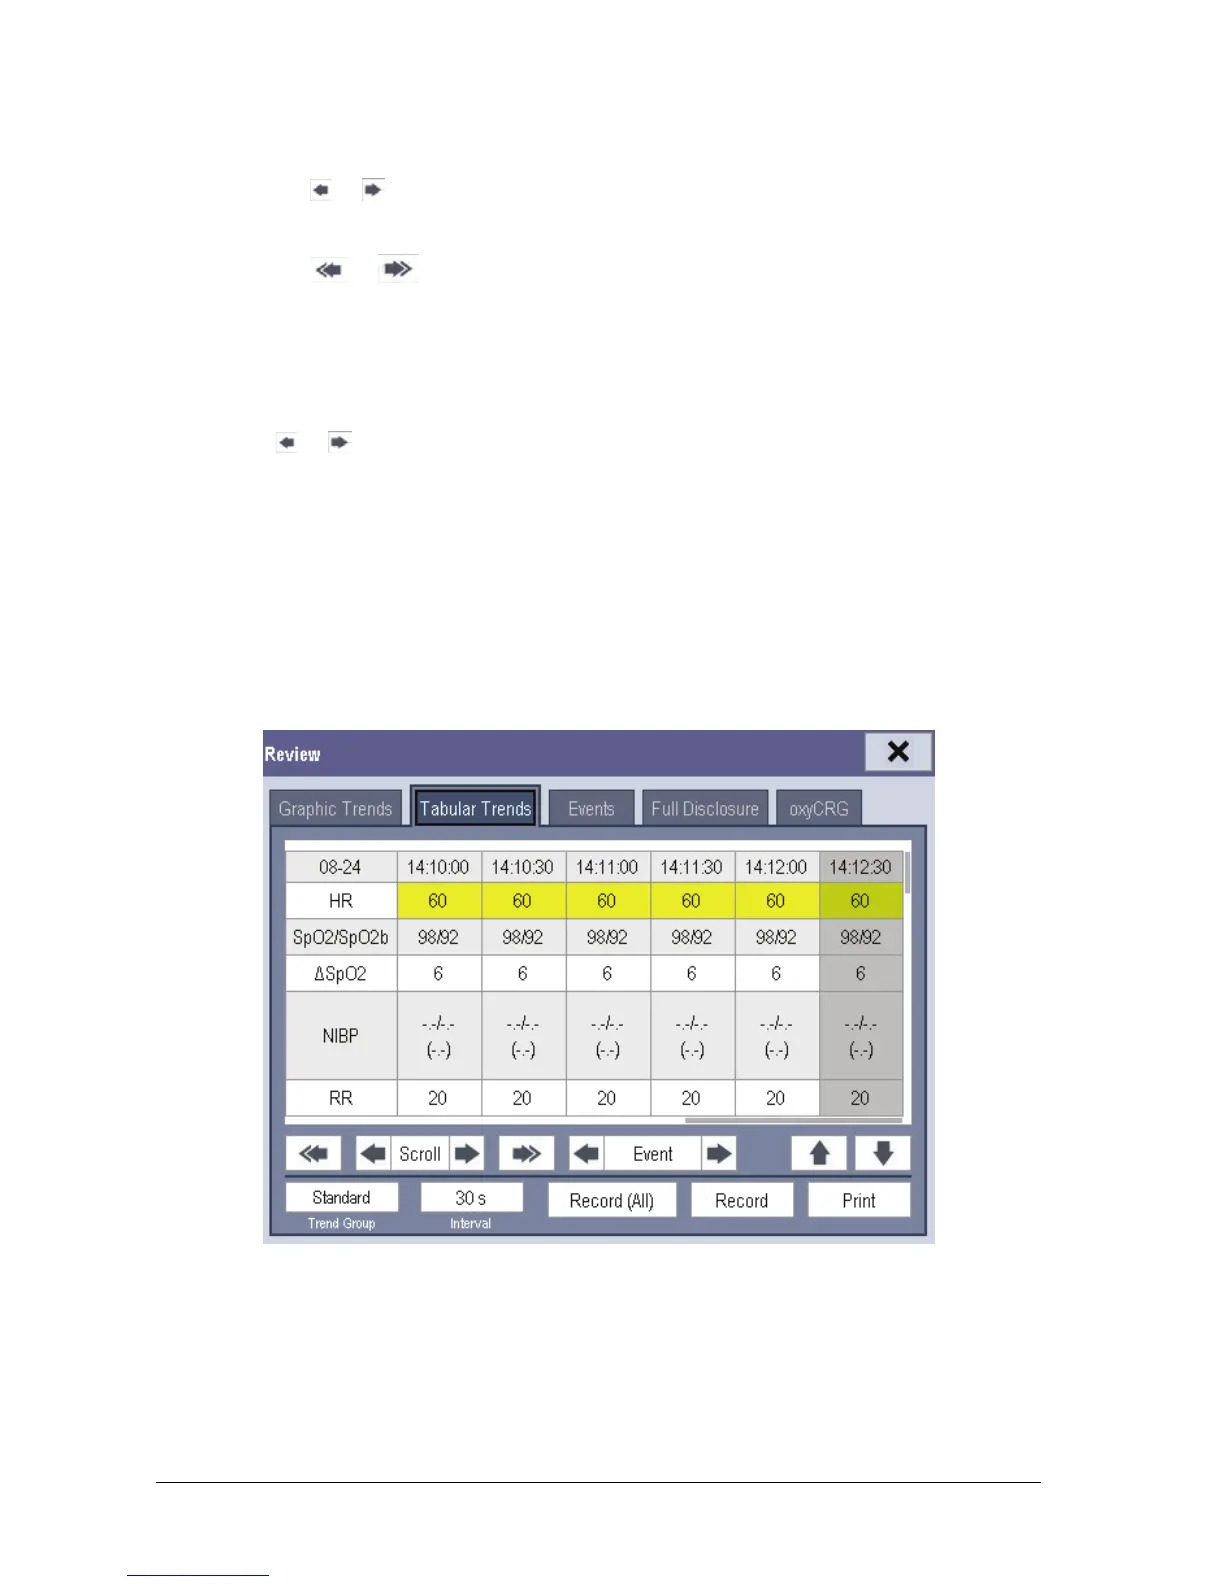
19.3 Reviewing Tabular Trends
In the [Review] menu, select [Tabular Trends] to access the following window.
Events are marked with colors in window’s top area. Red represents high level alarm event. Yellow represents
medium/low level alarm event. Green represents manual event.
 Loading...