2-35
IM 04L51B01-01EN
Operating the GX/GP
2
DisplayingMeasuredDatawithMaximumvaluesorMin/MaxValues
1
Press MENU.
The menu screen appears.
2
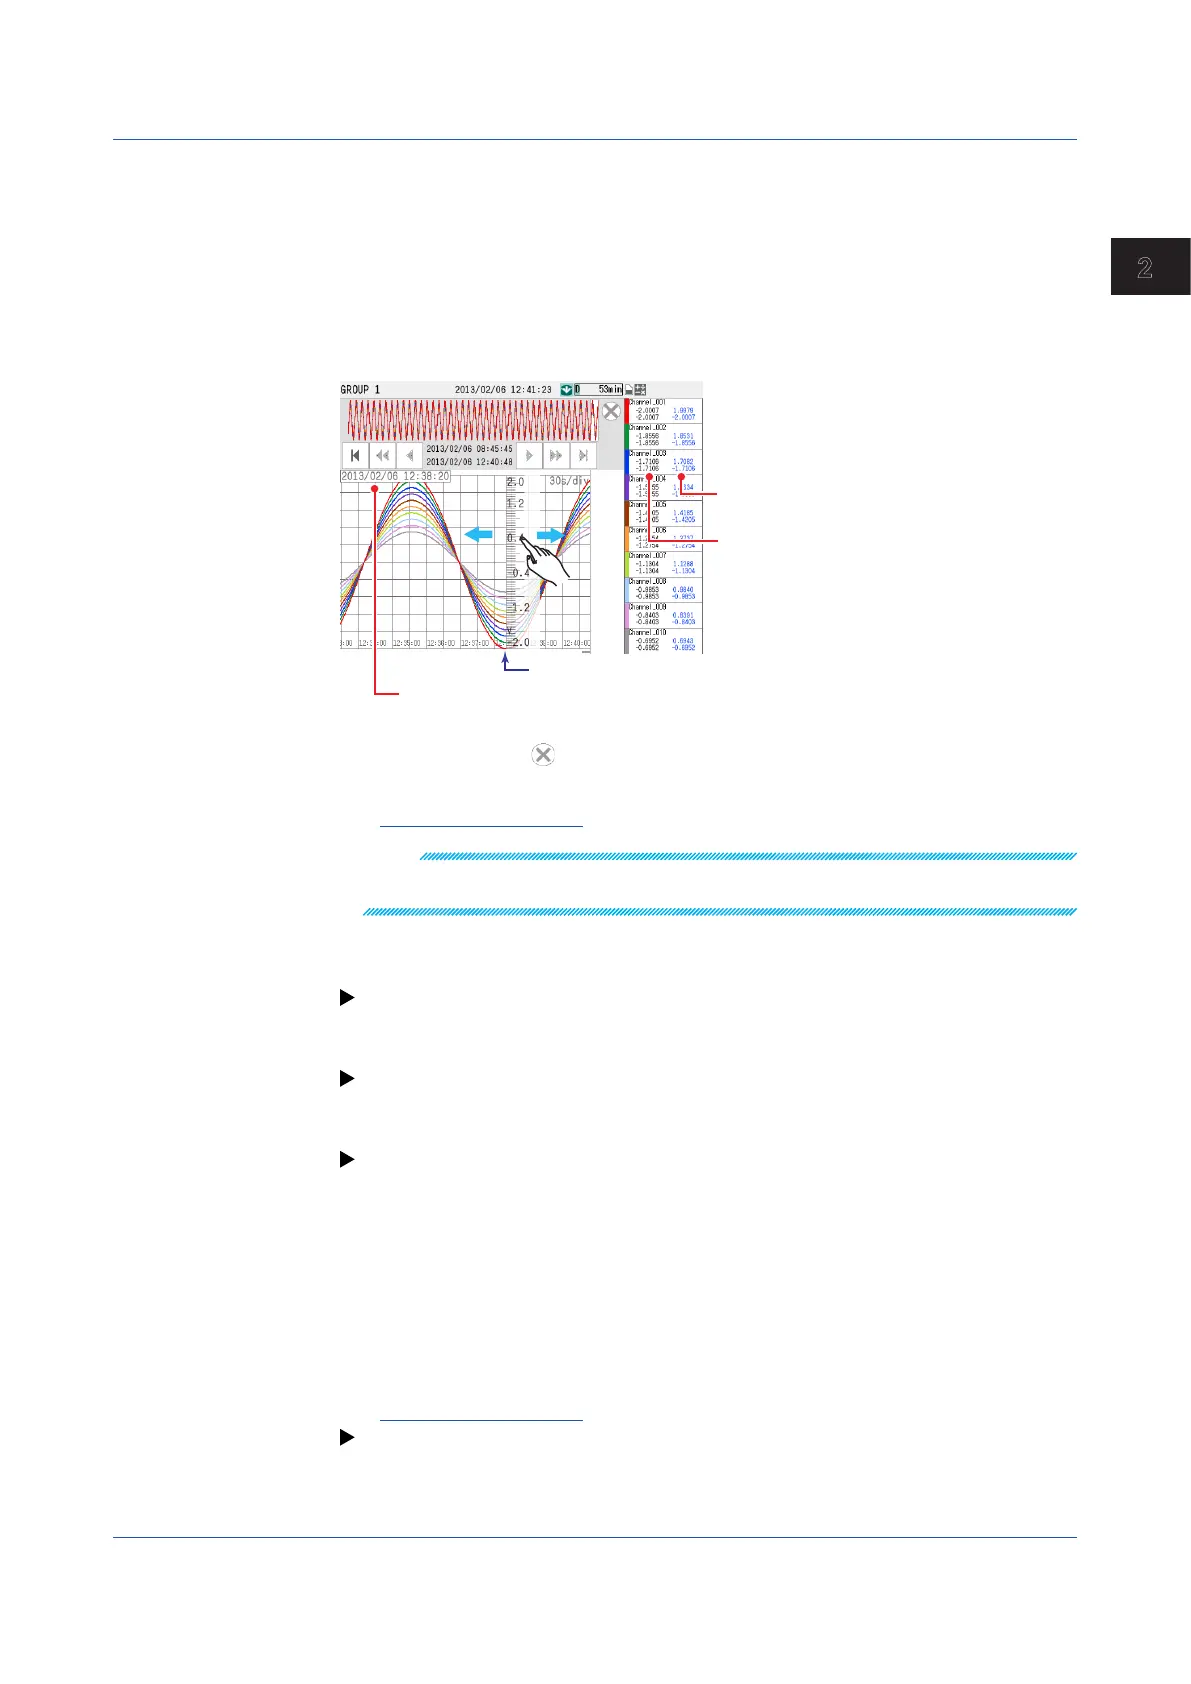
Tap the Context tab and then Valu Max Max/Min.
The digital display switches to Maximum or Min/Max display.
Each time you tap Min/Max (Value Max Min/Max), the display switches between Maximum and
Min/Max.
Maximum and minimum values among
the entire waveform data currently displayed
Time at the left edge of the scale image
Maximum and minimum values of the data
at the left edge of the scale image
Data position
3
Tap the Exiticon ( ).
Close the menu screen.
Operation complete
Note
If the scale image had been moved, after you switch the display, the image will return to its original
position.
SwitchingtheGrouptoDisplay
page 2-19 in section 2.2.2, “Switching the Group to Display”
Writing Registered Messages and Free Messages
page 2-24 in section 2.2.5, “Writing Registered Messages and Free Messages”
Writing Freehand Messages
page 2-29 in section 2.2.6, “Writing Freehand Messages”
Displaying the Alarm Summary of the Loaded Data
• DisplayingtheAlarmSummary
1
Press MENU.
The menu screen appears.
2
Tap the Context tab and then Alarm summary.
The alarm summary appears.
Operation complete
For details on the alarm summary, see page 2-41 in section 2.3.1, “Listing the Log of Alarm
Occurrences and Releases (Alarm Summary)”.
2.2 Configuration of Measured Data Display

 Loading...