3-7
IM 04L51B01-01EN
Using Network Functions (Ethernet interface)
3
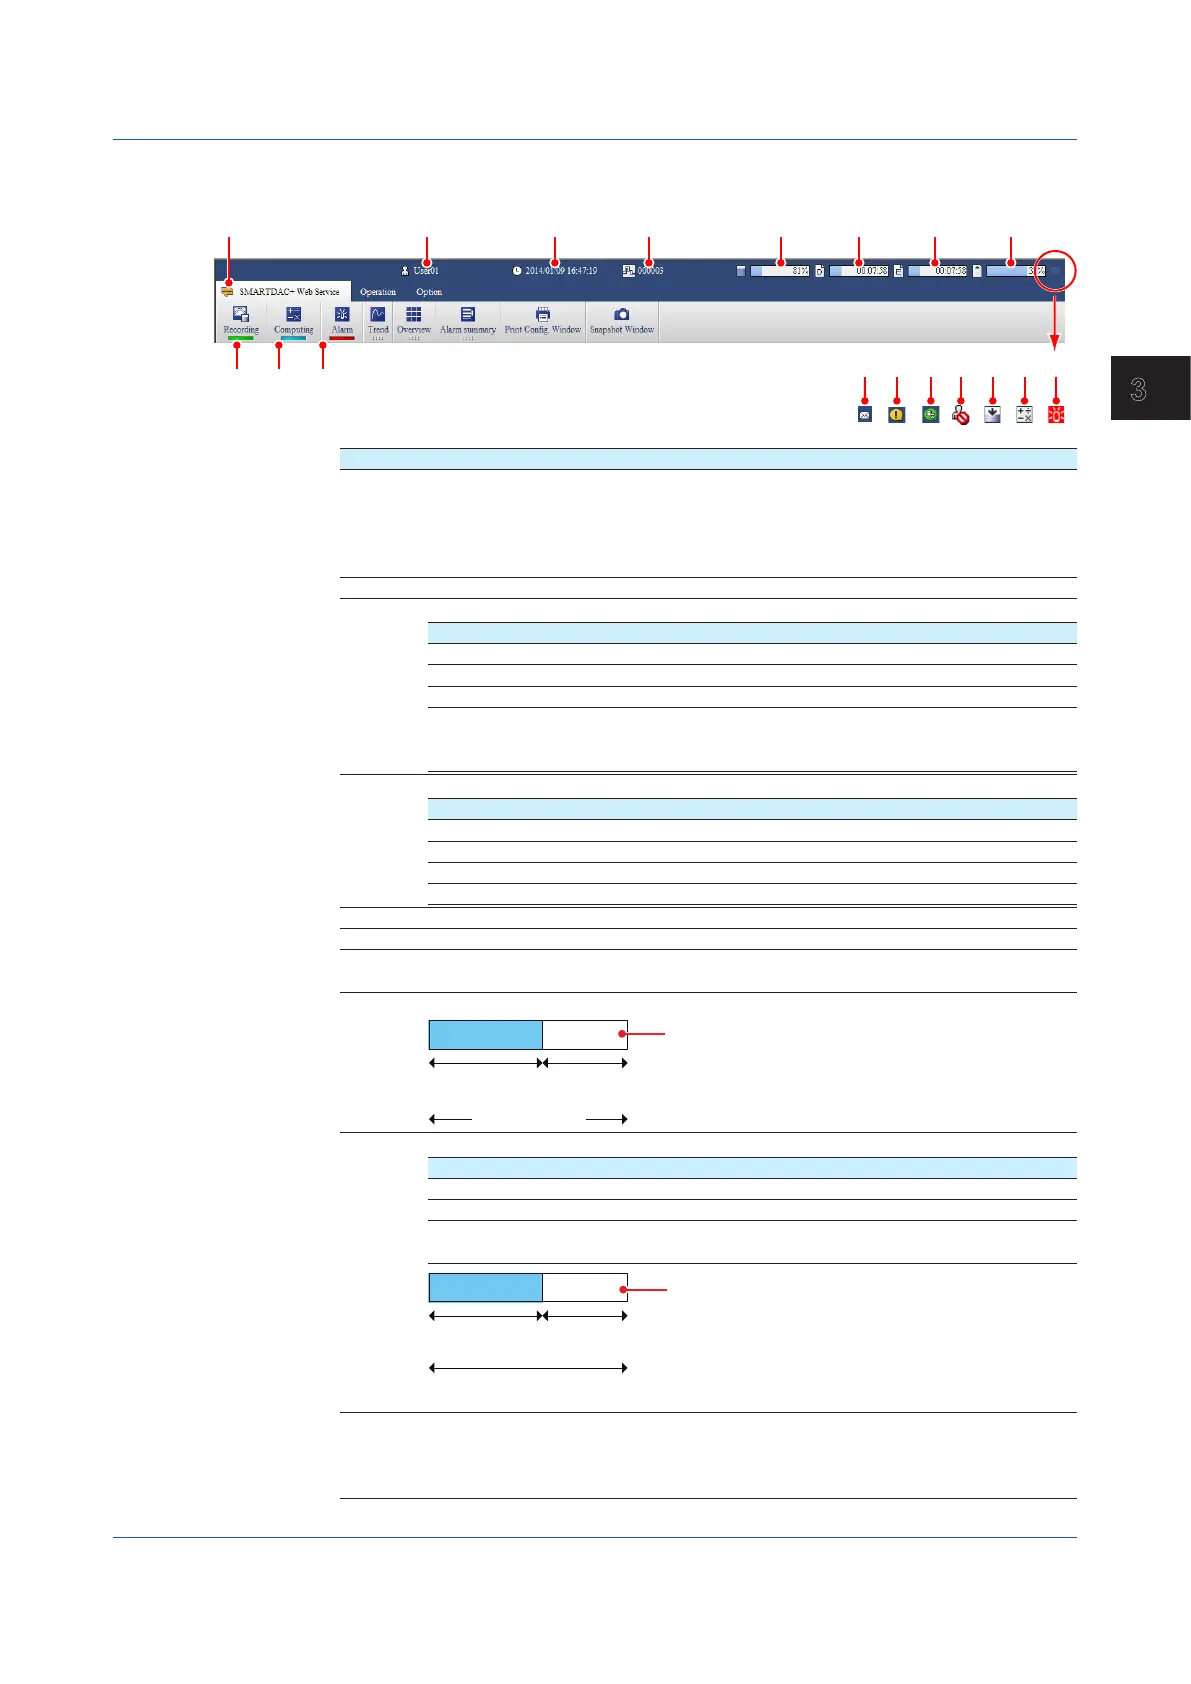
Status Indications
The menu bar shows the GX/GP status.
2 3 4
13 14
15 16
17 18 19
Number Description
1 Communication status. Turns on in yellow when communication with the GX/GP is
normal. If you move the mouse pointer over the icon and hold it there for about 1
second, “Normal” or “Error” will appear in a pop-up window. If communication with
the GX/GP is disconnected or recovers, a bubble message indicating the condition
will appear for a few seconds.
2 Recording status. Turns on in green when recording.
3 Indicates the computation status of computation channels.
Status Description
Off Computation stopped.
Blinking yellow Computation stopped with error.
Blue Computing.
Alternating
blue and
yellow
Computing with error.
4 Alarm status.
Status Description
Off No alarms. All alarms acknowledged.
Red Alarms present. All alarms acknowledged.
Blinking green No alarms. Unacknowledged alarms present.
Blinking red Alarms present. Unacknowledged alarms present.
5 Login user name.
6 GX/GP date and time.
7 Batch name. Displayed when the batch function is in use. If the information does
not fit in the area, the information will scroll at certain intervals.
8 Internal memory information.
Capacity
used
Capacity
remaining
Total capacity
42%
9 Recording progress status.
Icon Description
D icon Display data file
E icon Event data file
E1 icon Event data file of measurement group 1 (when the measurement
mode is set to Dual interval)
Time already
recorded
Time until the file is generated
Time
remaining
Time needed to
00:12:56
10 Recording progress status. Event data file information when both display data
and event data are recorded.
When the measurement mode is set to Dual interval, the information is for the
event data file of measurement group 2. (E2 icon)
3.1 Using the Web Application to Change the GX/GP Settings, Monitor Data, and Control the GX/GP (Web server function)
 Loading...