1-45
IM 04L51B01-01EN
Configuring the GX/GP and Viewing the Settings
1
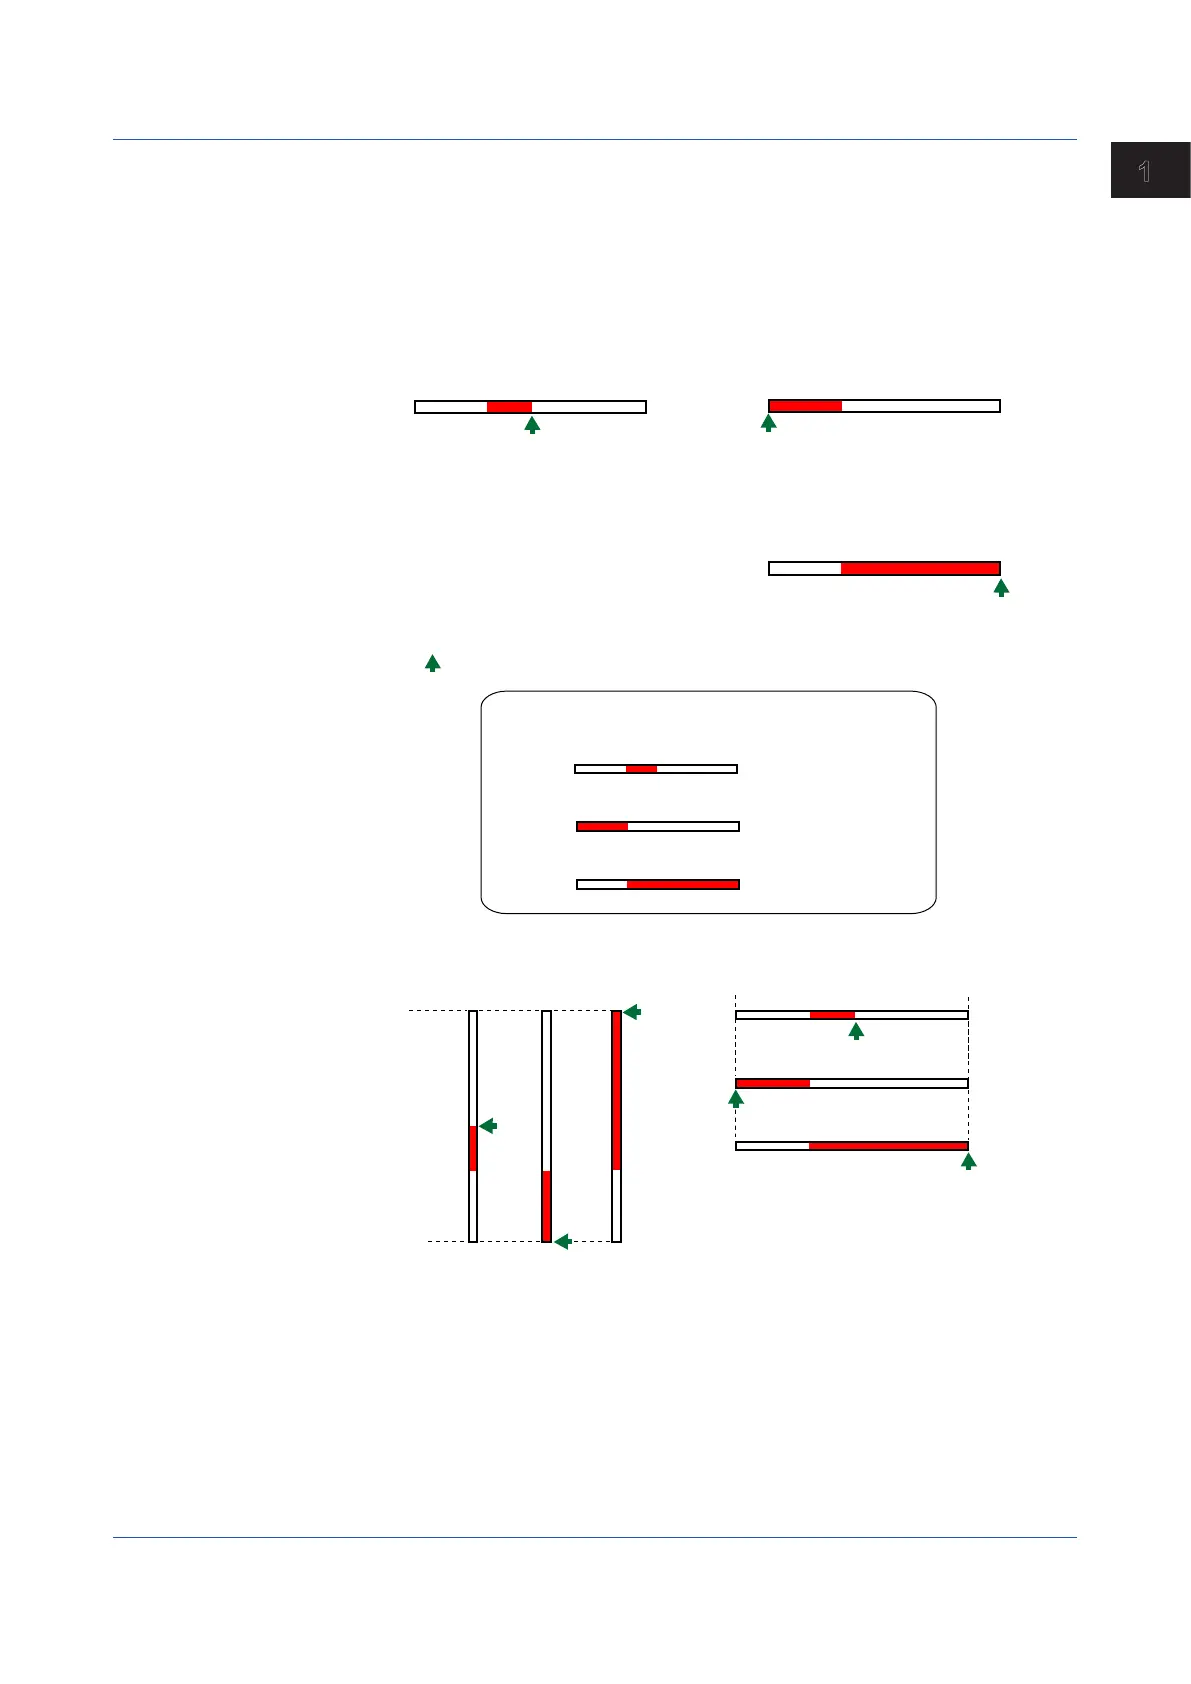
When the Display Direction of the Bar Graph Is Horizontal
The span lower limit (or scale lower limit) is at the left edge of the bar graph, and the span
upper limit (or scale upper limit) is at the right edge of the bar graph.
Starting point of the bar
Center: Center
Lower: Left edge
Upper: Right edge
Upper
V
lower
V
V
lower
V
V
lower
V
upper
Vupper: Span upper limit (or scale upper limit)
Vlower: Span lower limit (or scale lower limit)
: Starting point of the bar
Center
Upper
Lower
0.0
–100.0
0.0
–100.0
0.0
–100.0
Example: When the span lower and upper limits of the input
range are 0.0 and –100.0, respectively
When Displaying the Current Value on the Scale Using the Bar Graph
V
lower
V
upper
Center
Lower Upper
V
lower
V
upper
Center
Upper
Lower
Division
Set the number of divisions to make with the main scale marks.
1.2ConfiguringAIChannels(Analog(includingDI)input)channelsandAI(mA)channels