1-51
IM 04L51B01-01EN
Configuring the GX/GP and Viewing the Settings
1
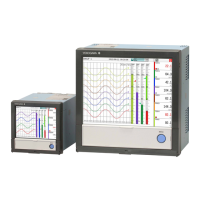
Bar Graph
If pre-trigger is specified for event data recording, the GX/GP will start recording pre-trigger
data when recording is started and the GX/GP enters the trigger-wait state. “Waiting”
appears in the bar graph. At this time, the progress bar turns orange.
When the pre-trigger time elapses, the length of the bar is fixed at that point. However, the
pre-trigger data is continuously updated in the background until the trigger condition is met.
When the trigger condition is met, the bar turns green, and data is recorded after the data in
the pre-trigger section.
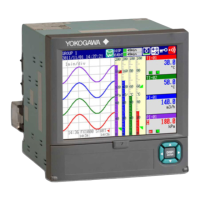
TrendDisplay(T-Y)
Measured data is displayed in a waveform.
Numeric display section
Trip lines (up to four lines)
Waveform (displayed using the channel display color)
Message
Current value mark
Trend interval
Time at the grid position
Tag or channel number, measured value, and unit
Alarm point mark
Color scale band
• AlarmIndication
Alarm mark, alarm type, and measured value are displayed as follows depending on the
alarm status.
They are shared with the digital and bar graph displays.
Alarm
Release
Blinking
red,brown
Blinking
gray
Blinking
red,brown
None Red RedNone None None None None
Alarm ACK Alarm ACK
Occurrence
When indication is
set to non-hold
When indication is
set to hold
Alarm mark
(type)
Red Black Red
Black Red RedBlack Black Black Black Black
Measured
value
Blinking
red,brown
Blinking
gray
Blinking
red,brown
None Red RedNone None NoneNone None
Alarm icon
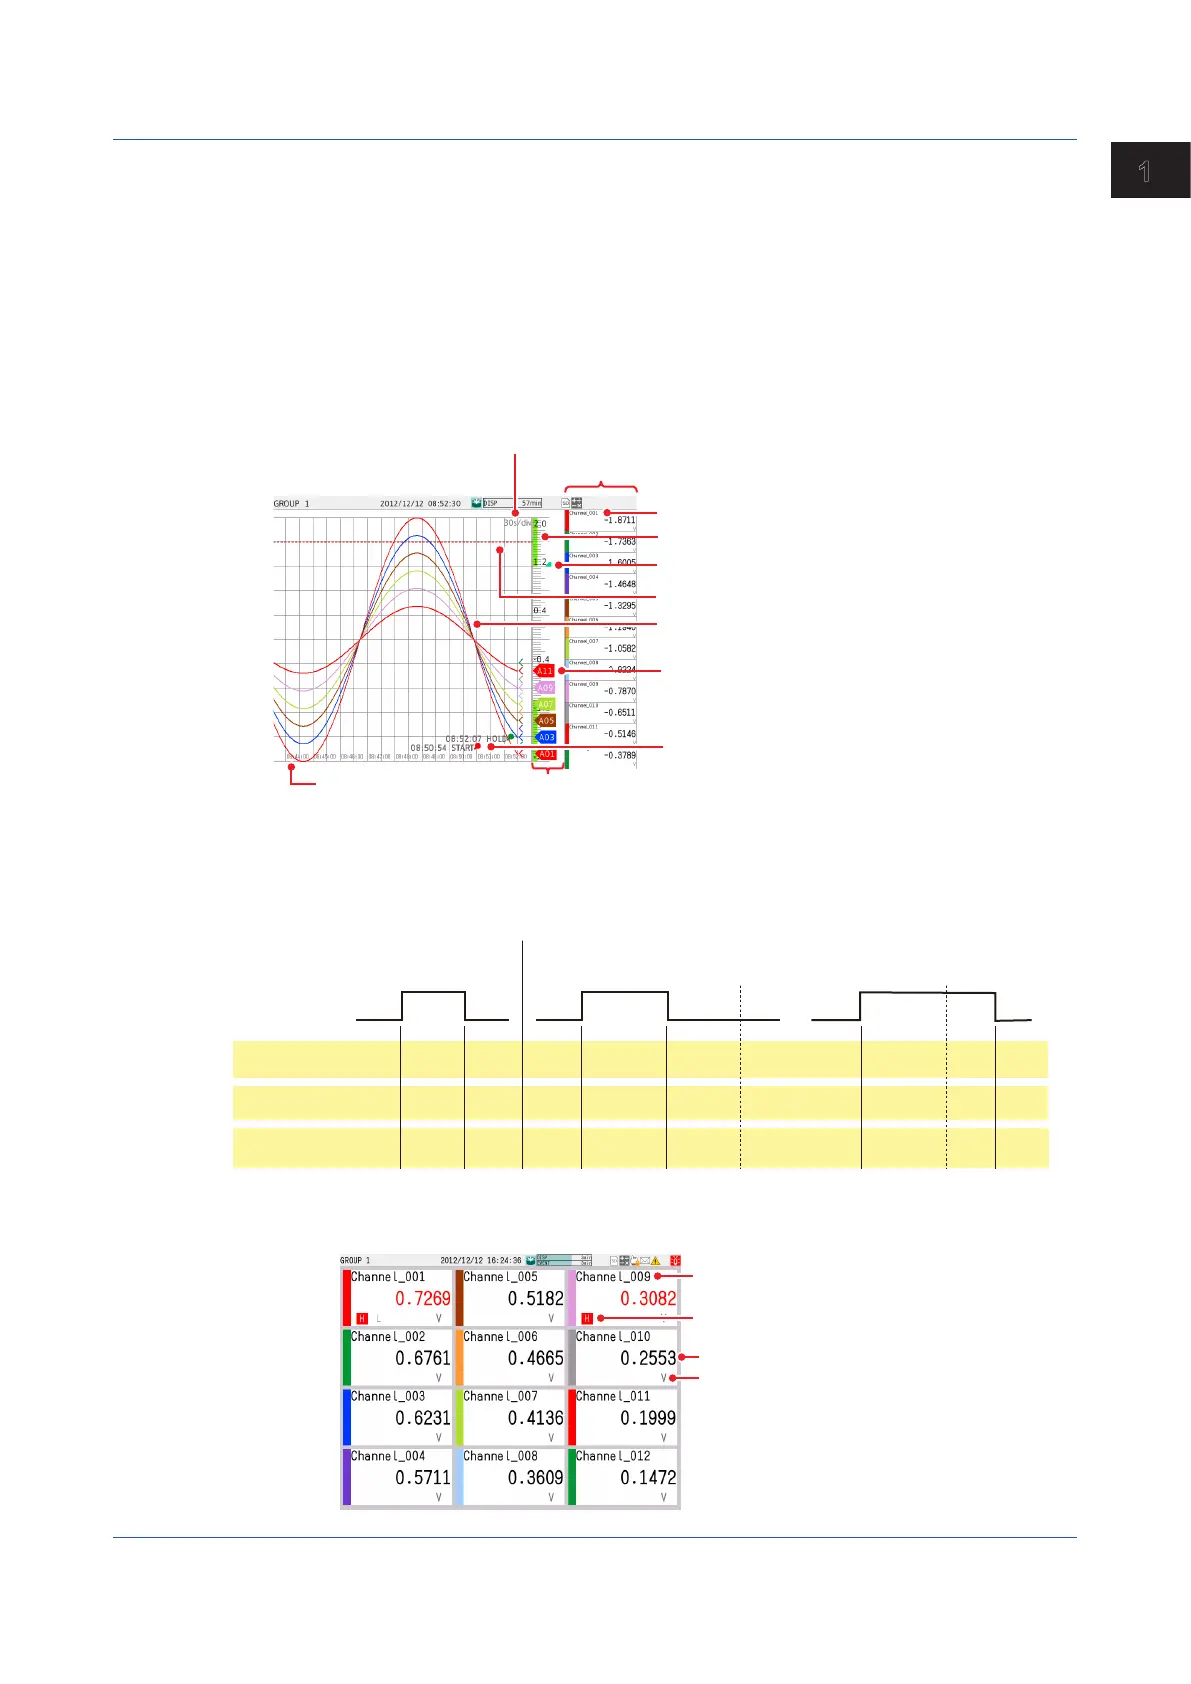
Digital Display
The digital display shows measured data using large numbers.
Unit
Alarm mark
Channel number, tag, or tag No.
Measured value
1.2ConfiguringAIChannels(Analog(includingDI)input)channelsandAI(mA)channels
 Loading...