2-32
IM 04L51B01-01EN
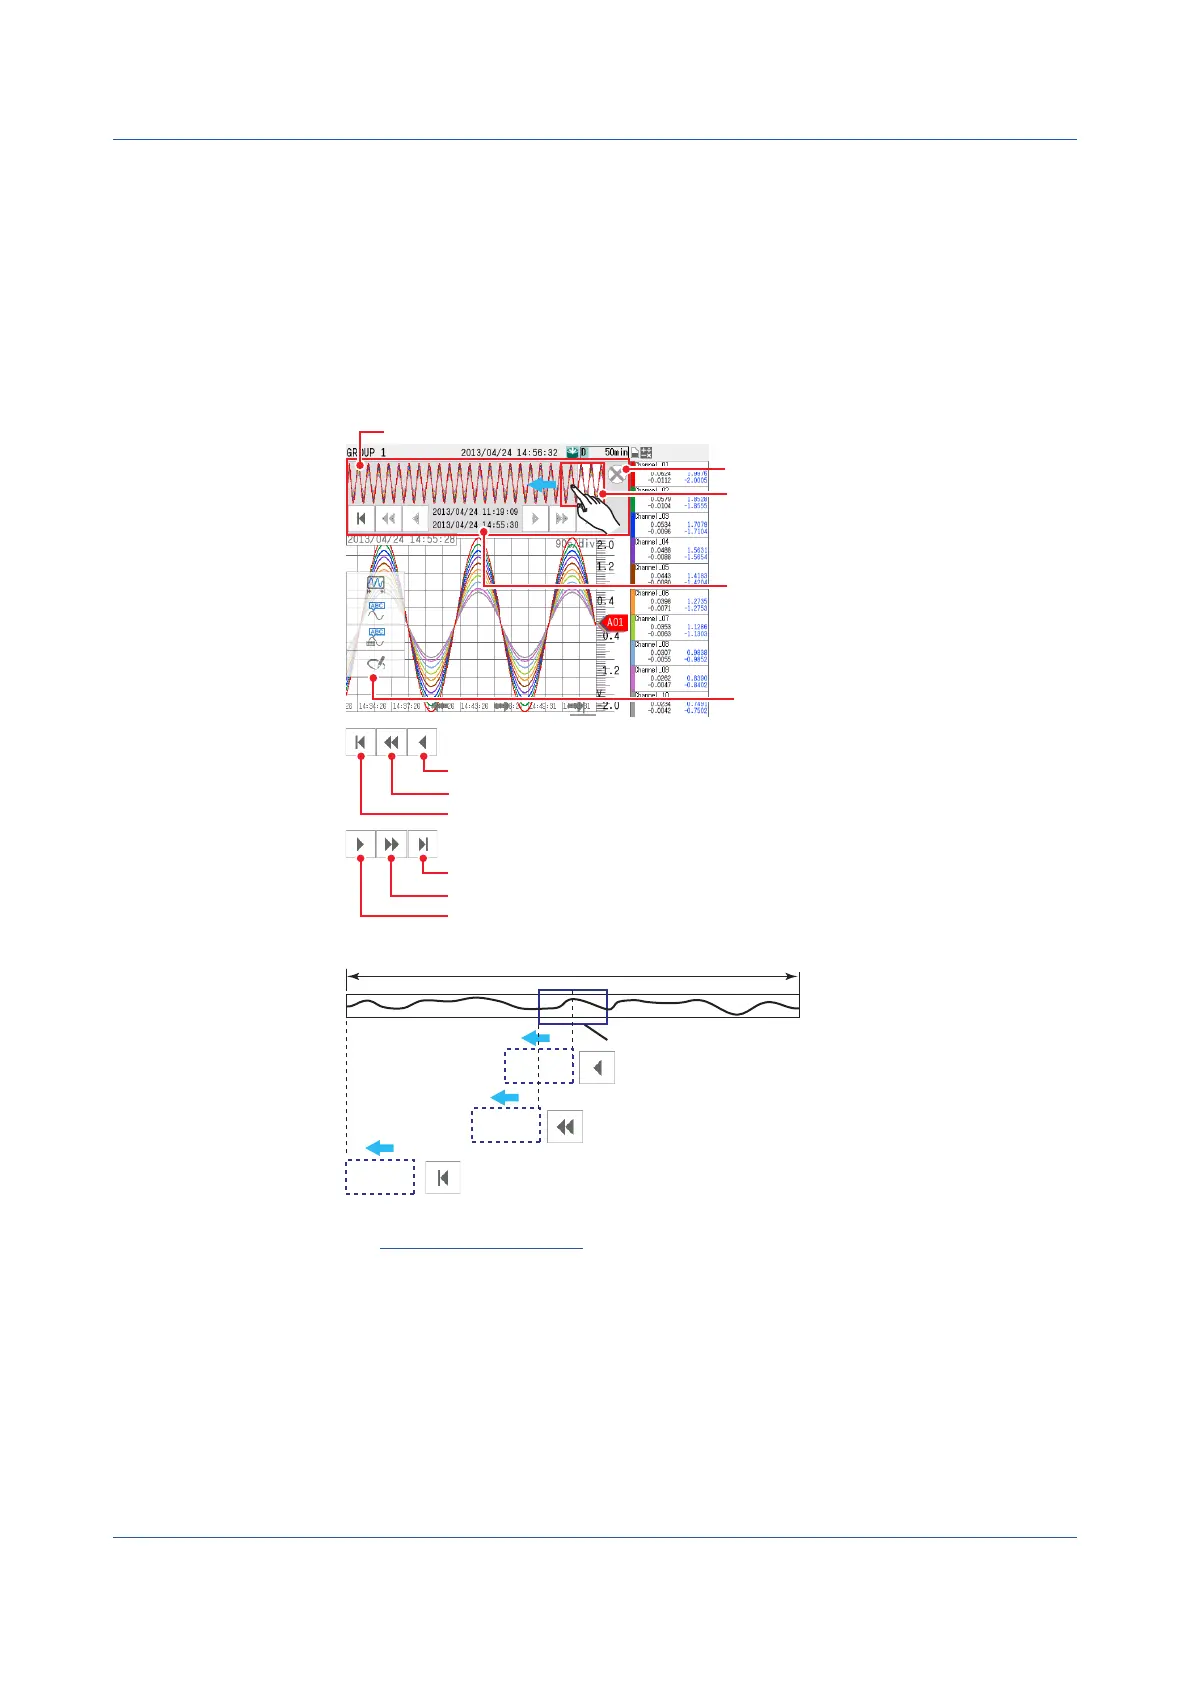
DisplayingtheEntireMeasuredData
1
Press MENU.
The menu screen appears.
2
Tap the Context tab and then All data display.
The entire measured data is displayed.
It may not be possible to display all the measured data depending on the measure data size. You
can use the switch icons to change the range to load.
If there is measured data that can be loaded, switch icons appear in gray and are enabled.
Otherwise, switch icons appear dimmed (light gray) and are disabled.
Clears all display
All display
Highlighted area
The waveform section that is currently
displayed.
Drag this area to move the display area.
Date and time of the all display area
Top line: Time of the oldest data
(the left edge of the waveform).
Bottom line: Time of the most recent
data (right edge of the waveform).
Current entire display range (Loaded data range)
All measured data
Half of the displayed data is replaced with older data.
All the displayed data is replaced with older data.
The oldest data is loaded.
The most recent data is displayed.
All the displayed data is replaced with more recent data.
Half of the displayed data is replaced with more recent data.
Half of the data is replaced.
All the data is replaced.
The oldest data is loaded.
Shortcut icon
Operation complete
Shortcut Icon Operation
You can touch the screen to display shortcut icons; you do not have to display the menu
screen first.
You can tap these shortcut icons to operate the GX/GP.
2.2 Configuration of Measured Data Display
 Loading...