<9. Calibration>
9-2
IM 11M12G01-02EN 1sh Edition : Mar. 25, 2021-00
0.1
0.5 1 5 10 21.0
50 100
120
100
80
60
40
20
0
-20
-40
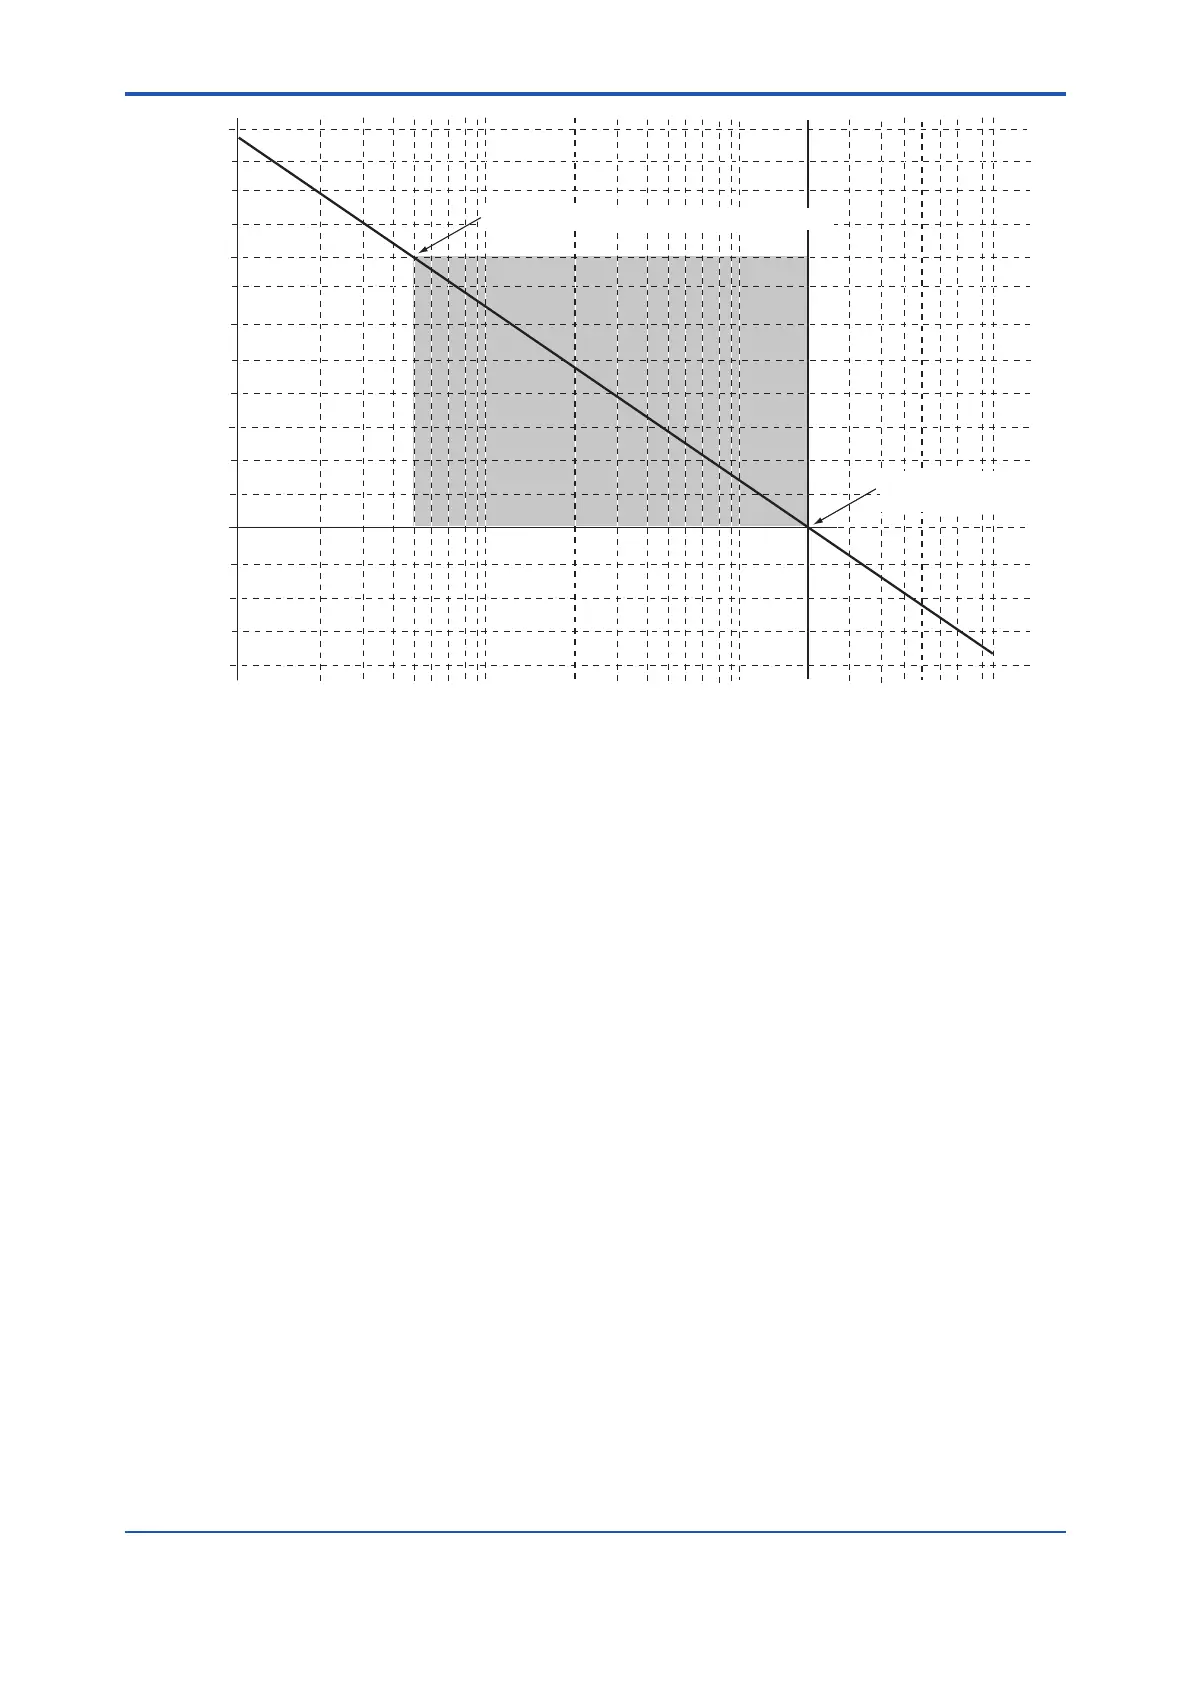
0.51 vol% O2,81.92mV(Zero origin of calibration)
21.0 vol% O2, 0mV
(Span origin of calibration)
Oxygen concentration (vol % O
2)
Cell
voltage
(mV)
F9.1E.EPS
Figure 9.1 Oxygen concentration in a Sample Gas vs Cell Voltage (21 vol%O
2
Equivalent)
The measurement principles of a zirconia oxygen analyzer have been described above.
However, the relationship between oxygen concentration and the electromotive force of a cell is
only theoretical. Usually, in practice, a sensor shows a slight deviation from the theoretical value.
is conducted so that a calibration curve is obtained, which corrects the deviation from the
theoretical cell electromotive force.
9.1.2 Measurement Principle of Zirconia Humidity Analyzer
A solid electrolyte such as zirconia allows the conduction of oxygen ions at high temperatures.
Therefore, when a zirconia-plated element with platinum electrodes on both sides is heated up
from a high partial-oxygen pressure to a low partial-oxygen pressure, causing a voltage. When
a sample gas introduced into the zirconia-plated element with the measurement electrode, and
where, R = Gas constant
T = Absolute temperature
n: 4
F = Faraday’s constant
y = O2 vol % on the zirconia element measurement electrode
a = O2 vol % to 21.0 vol % O2 on the zirconia element reference electrode
The humidity analyzer uses a sample gas composed of water vapor and air.
(A) For the vol % H2O measurement
x:Assuming that H2O vol % in a mixed gas is measured:
 Loading...