<10. Other Functions>
10-1
IM 11M12G01-02EN 1sh Edition : Mar. 25, 2021-00
10. Other Functions
10.1 Detailed-data Display
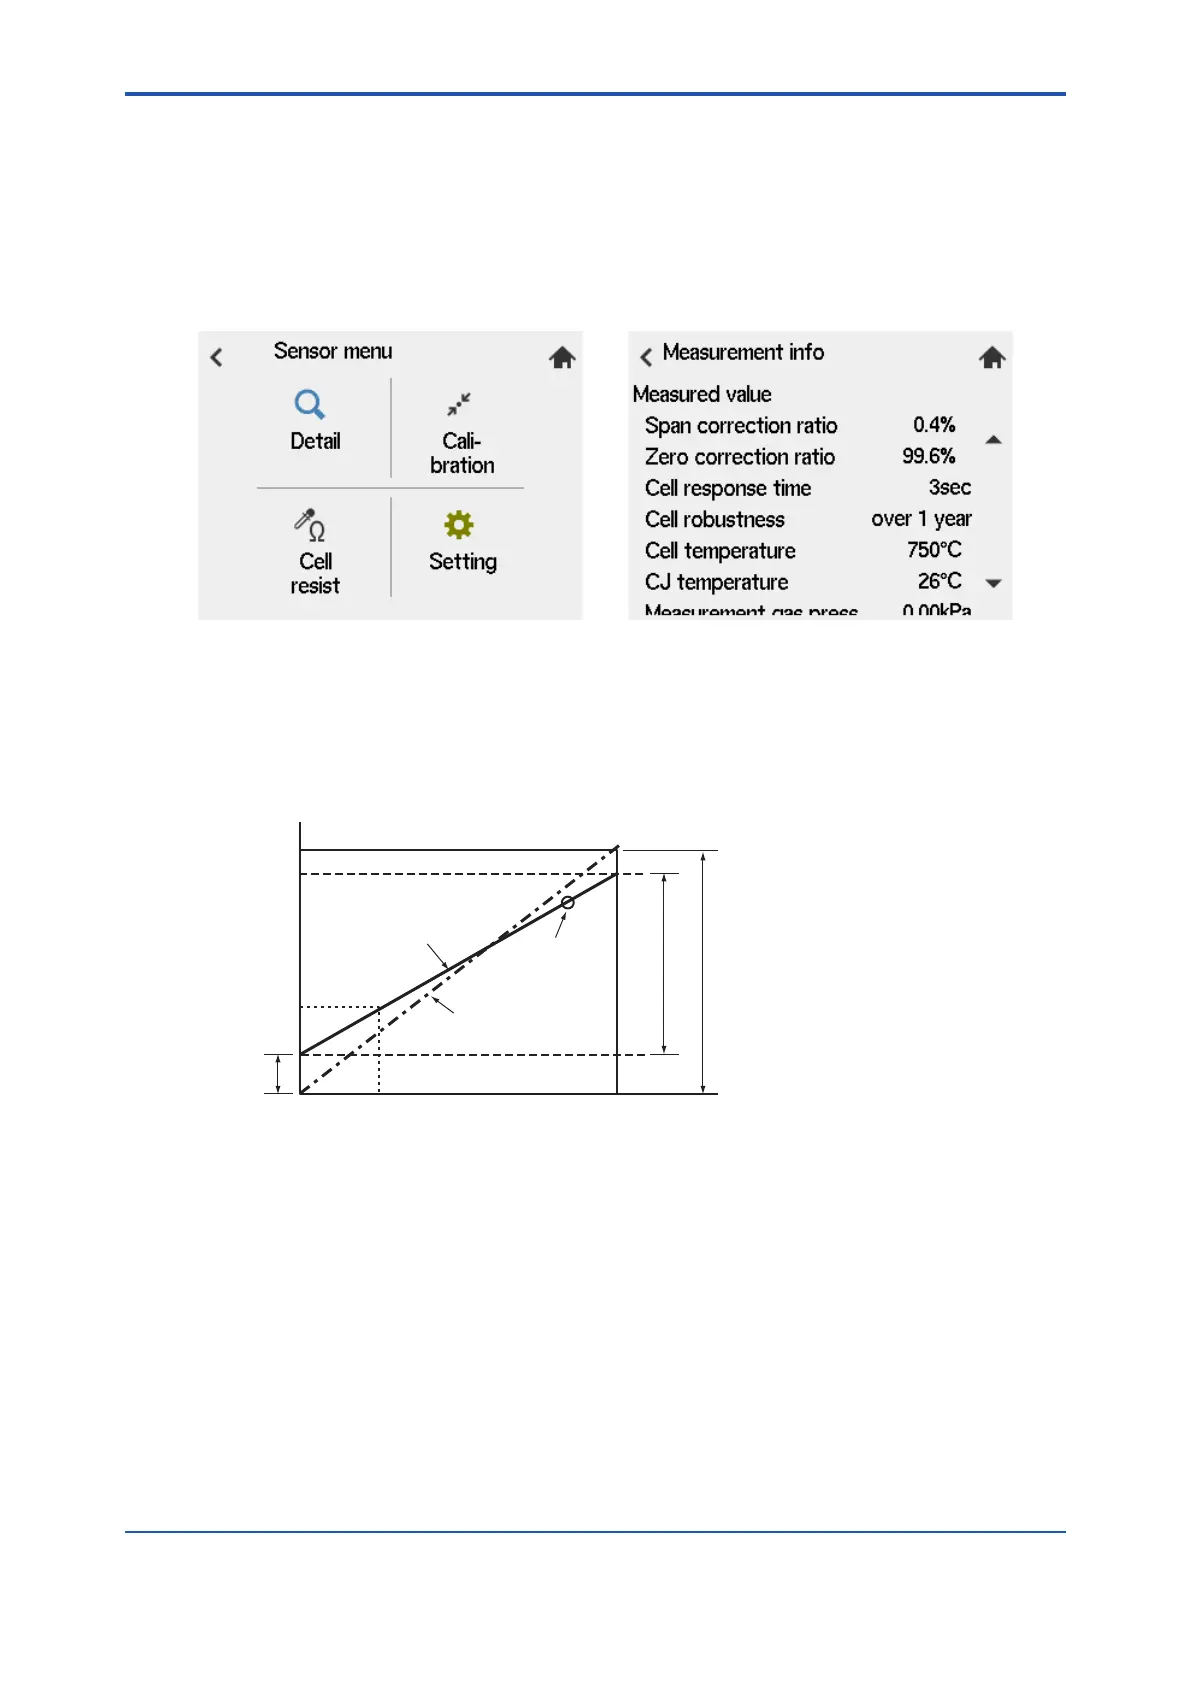
“Sensor menu” > “Detail”
This section describes each data of sensors.
Figure 10.1 Detailed-data Display
10.1.1 Span correction ratio, Zero correction ratio
These are used to check for degradation of the sensor (cell). If the correction ratio is beyond the
limits as shown in Figure 10.2, the sensor should no longer be used.
These ratios can be found by calculating the data as shown below.
21.0 p1 0.51
81.92
ez
e1
es
0
C
AB
Zero gas correction ratio = (B/A) x 100 (%) Correctable range: 100 ± 30%
Span gas correction ratio = (C/A) x 100 (%) Correctable range: 0 ± 18%
Cell
electromotive
force, mV
Calibration curve
before correction
Previous
zero gas data
Corrected calibration curve
(theoretical calibration curve)
Zero origin
Span origin
Span gas
concentration
Oxygen concentration (vol%O
2
)
F10.2E.ai
Figure 10.2
10.1.2 Cell response time
The cell’s response time is obtained in the procedure shown in Figure 10.3. If only either a zero-
point or span calibration has been carried out, the response time will not be measured just as it
will not be measured in manual calibration.
 Loading...