4.
The NTP Performance Graph panel will appear.
5.
To select the statistics for a particular day, select a date from the drop-down list in
the Select Day for Statistics field. The default date is the present date. Click the
Apply button.
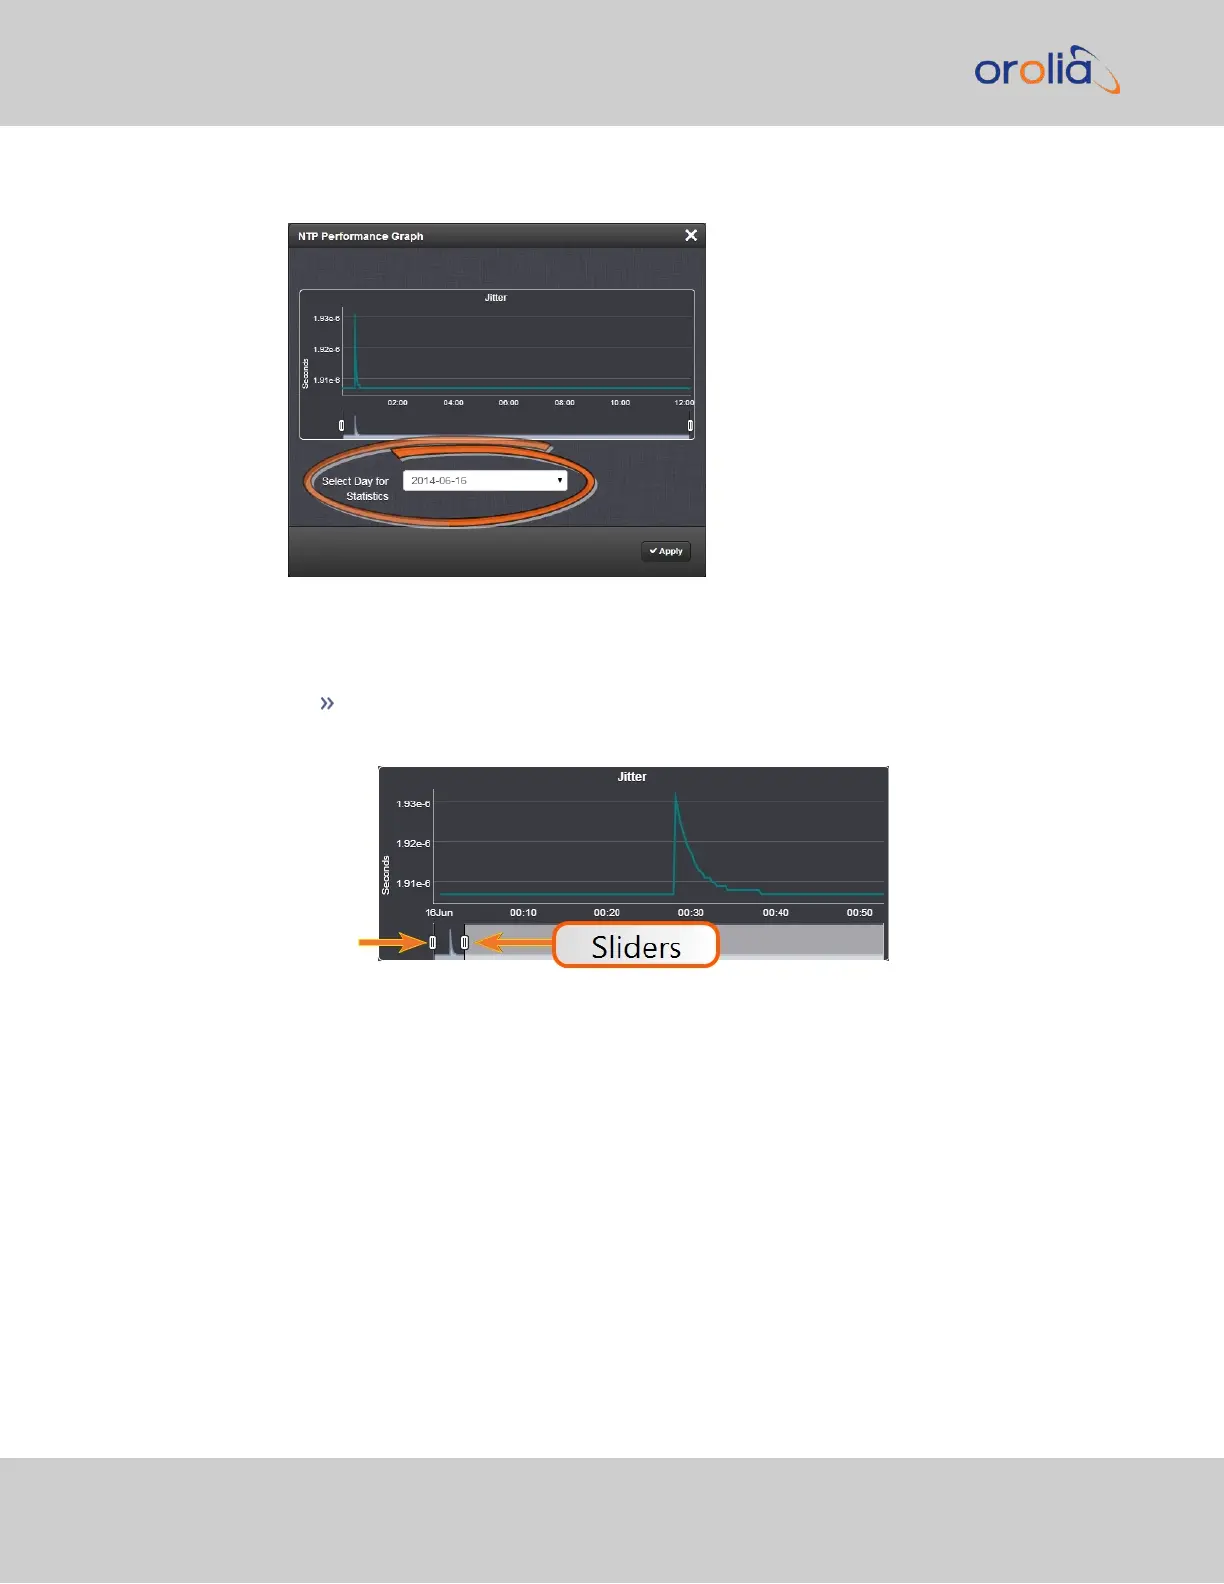
To display a higher resolution graph for a shorter time span, move one or both
time sliders at the bottom of the graph inwards.
4.6.2 Logs
VersaSync maintains different types of event logs (see below) to allow for traceability, and
for record keeping. Should you ever require technical support from Orolia, you may be
asked for a copy of your logs to facilitate remote diagnosis.
Logs stored internally are being kept automatically, while the storage of log files in a
remote location has to be set up by the user.
For each type of log, four 75KB files are maintained internally on a revolving basis, i.e. the
oldest file will be overwritten, as soon as all four files have filled up with event data. The life
expectancy of a log file depends on the amount of data accumulating over time: Some
types of logs will fill up within days, while others can take months until they have reached
their maximum storage capacity.
242
CHAPTER 4 • VersaSync User Manual Rev. 7.0
4.6 Quality Management
 Loading...