Monitoring intelliFlow
Digi Connect IT® 16/48 User Guide
629
a. Click the menu icon ().
b. Select the number of top users to displayed.
7. Save or print the chart.
a. Click the menu icon ().
b. To save the chart to your local filesystem, select Export to PNG.
c. To print the chart, select Print chart.
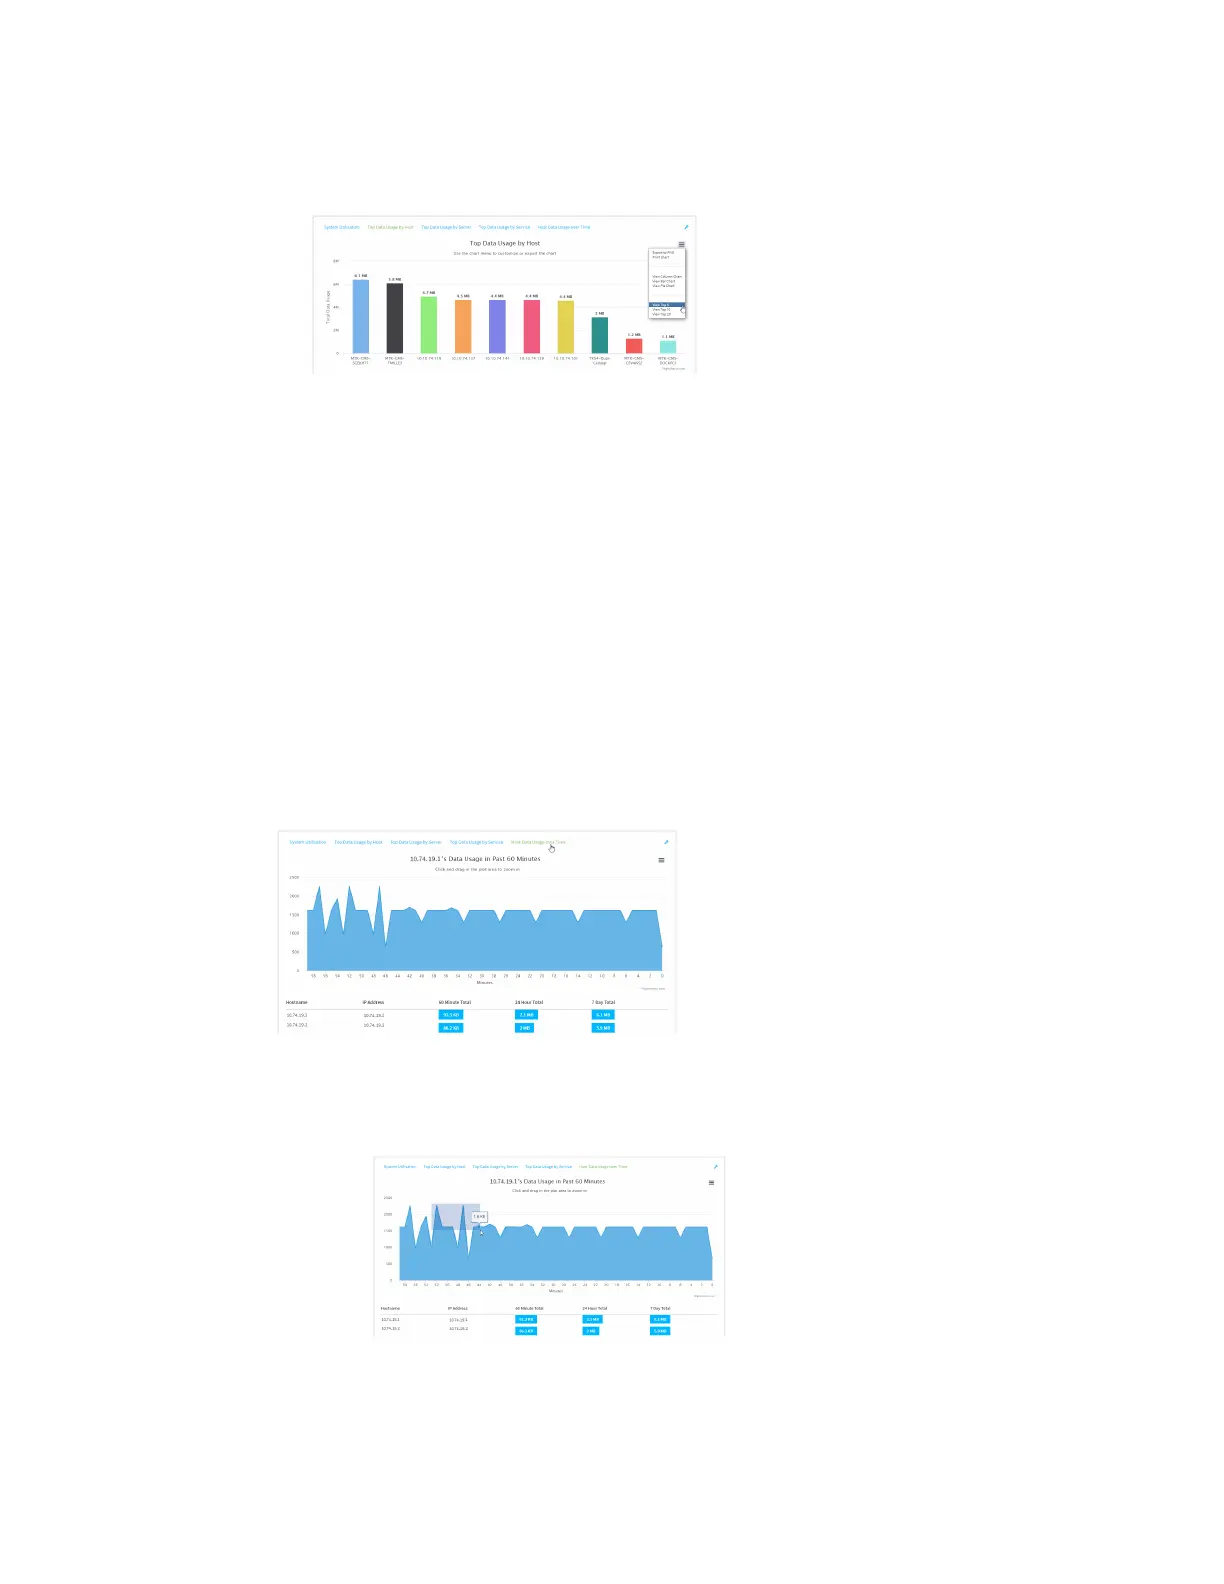
Use intelliFlow to display data usage by host over time
To generate a chart displaying a host's data usage over time:
WebUI
1. Log into the Connect IT 16/48 WebUI as a user with Admin access.
2. If you have not already done so, enable intelliFlow. See Enable intelliFlow.
3. From the menu, click Status > intelliFlow.
4. Click Host Data Usage Over Time.
n Display more granular information:
a. Click and drag over an area in the chart to zoom into that area and provide more
granular information.
 Loading...