5.1 Observing Waveforms
135
Chapter 5 Waveform Analysis
5
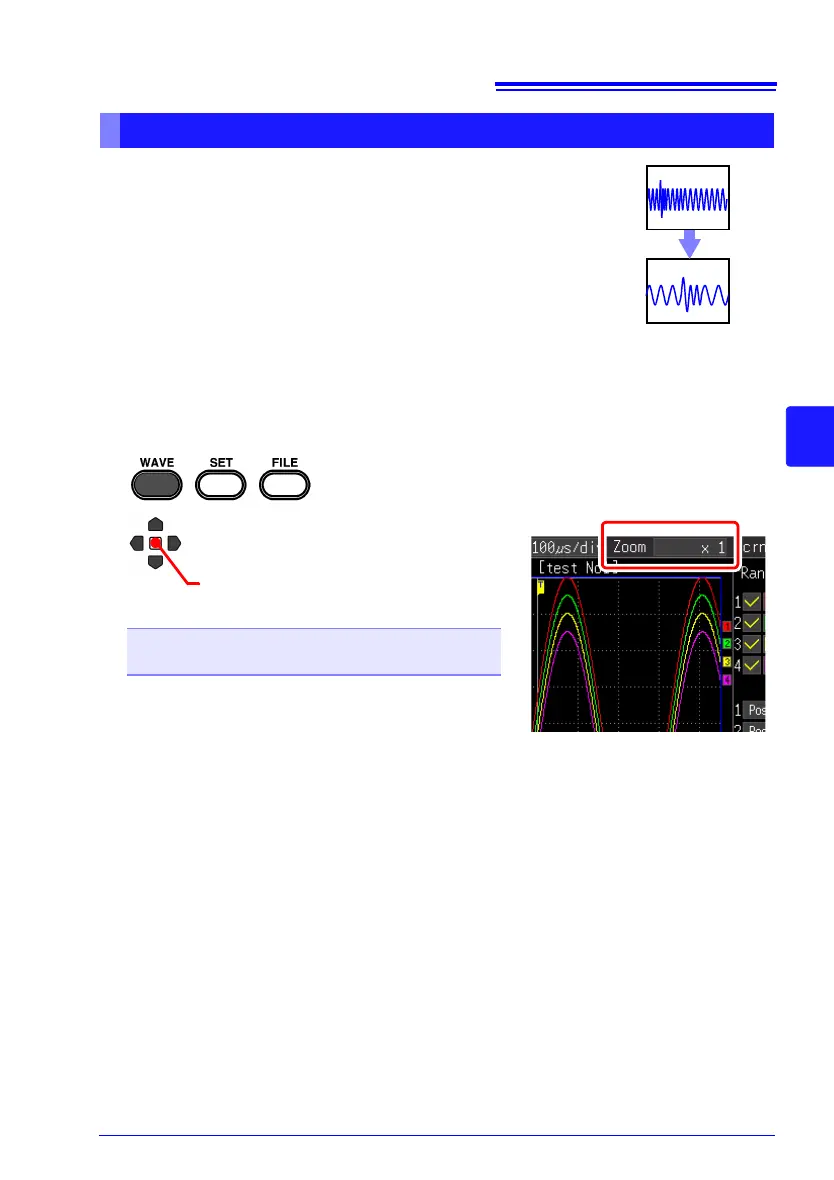
Data details can be observed by magnifying the waveform
along the time axis. Also, by compressing the time axis,
overall waveform fluctuations can be readily seen.
When the A/B cursors are displayed in [Cursor] display,
magnification can be set according to cursor position (but
only when finished measuring).
The setting options for the expansion and compression meth-
od differ depending on the function.
High-speed Function (when [Timebase] setting)
Change the display magnification
Magnifying and Compressing Horizontally
1
2
(Open/confirm the setting information.)
Select from the setting options of
[Zoom].
Setting options (∗. default setting)
x10, x5, x2, x1∗, x1/2, x1/5, x1/10, x1/20, x1/50,
x1/100, x1/200, x1/500, x1/1000, x1/2000
Example: When the time base range is 100 µs/div
The value per division is as follows depending on the
magnification.
• x10: 100μs/div÷10 = 10μs/div
• x1/100: 100
μs/div x 100 = 10ms/div
 Loading...