Assuming that no resistance is present in X
L
or X
C
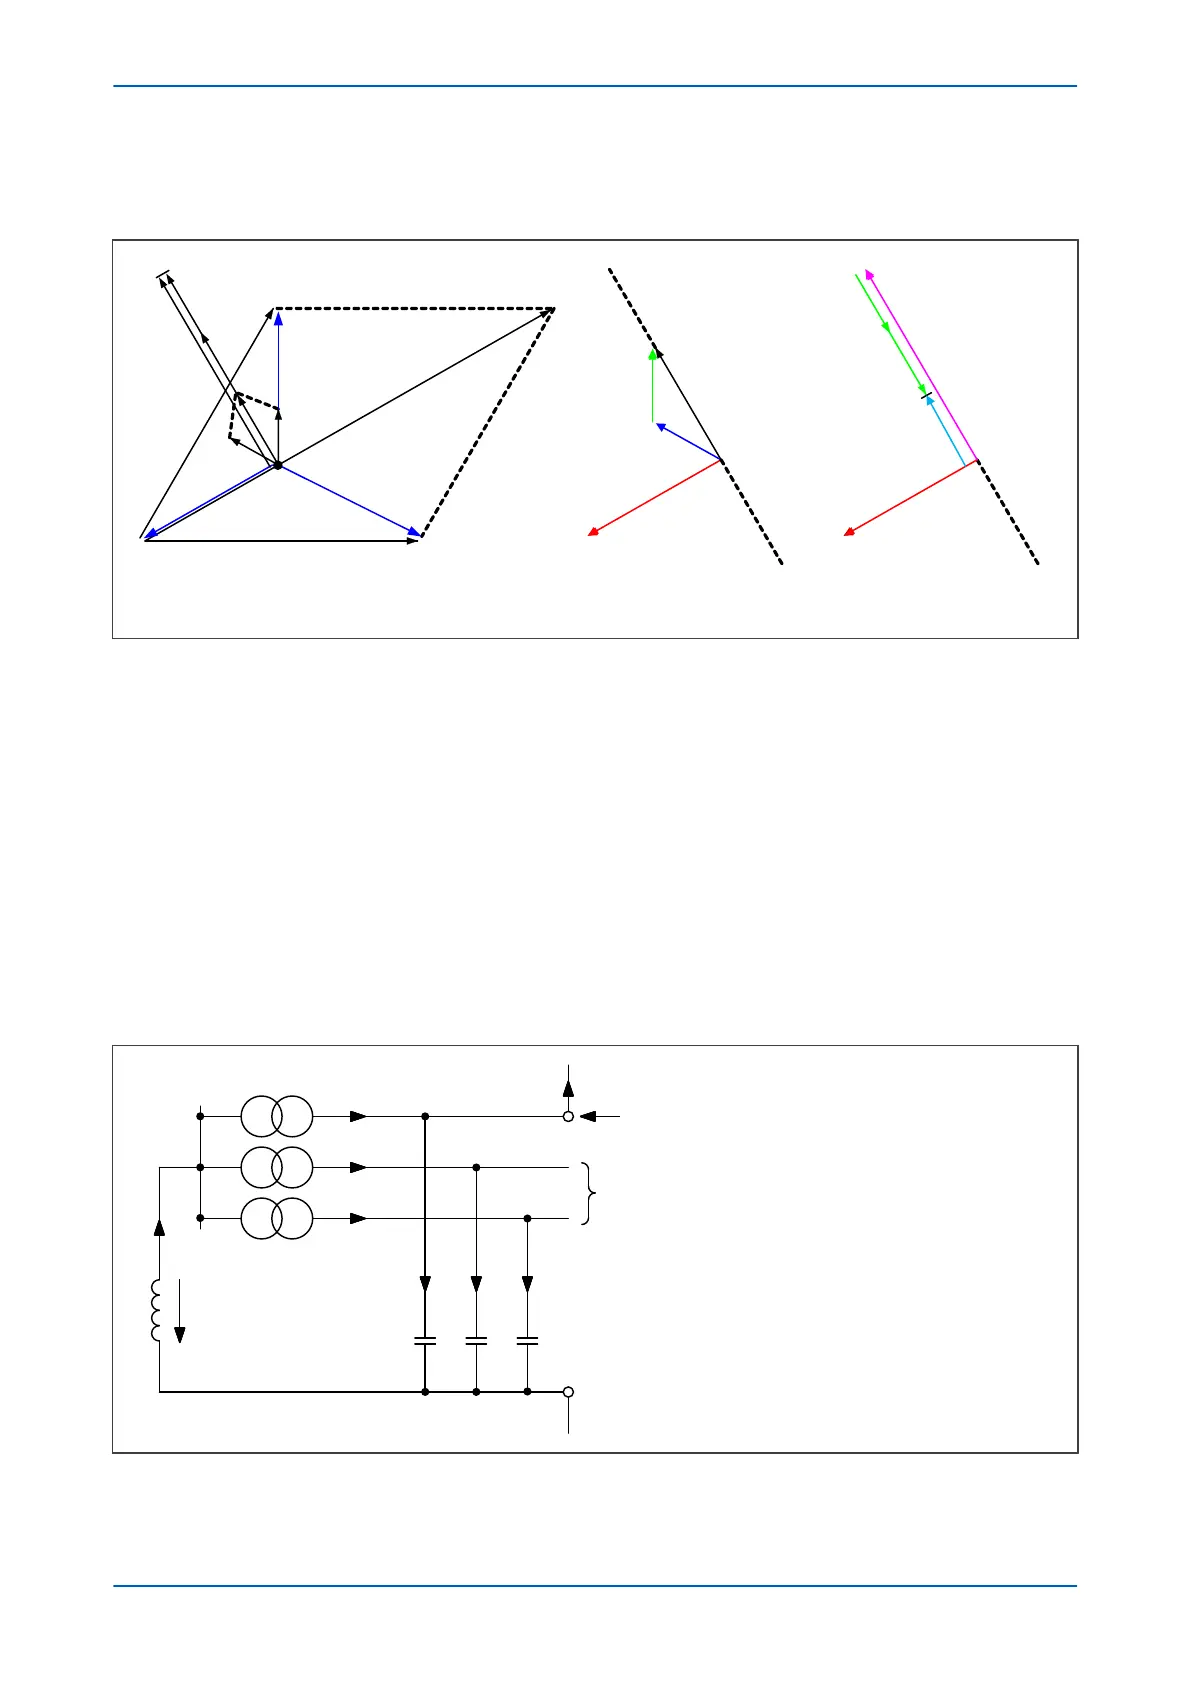
, the resulting phasor diagrams will be as shown in the figure
below:
V00633
V
res
= -3V
o
I
R1
= I
H1
I
a1
I
b1
V
res
= -3V
o
I
R3
= I
F
+ I
H3
I
L
-I
H1
-I
H2
I
R3
= I
L
- I
H1
- I
H2
a) Capacitive and inductive currents
C B
A 3V0
I
H3
I
H2
IL
I
H1
I
B1
IA1
N
b) Unfaulted line c) Faulted line
Figure 85: Phasors for a phase C earth fault in a Petersen Coil earthed system
It can be seen that:
● The voltage in the faulty phase reduces to almost 0V
●
The healthy phases raise their phase to earth voltages by a factor of Ö3
● The triangle of voltages remains balanced
● The charging currents lead the voltages by 90°
Using a core-balance current transformer (CBCT), the current imbalances on the healthy feeders can be measured.
They correspond to simple vector addition of I
A1
and I
B1
, I
A2
and I
B2
, I
A3
and I
B3
, and they lag the residual voltage
by exactly 90º.
The magnitude of the residual current I
R1
is equal to three times the steady-state charging current per phase. On
the faulted feeder, the residual current is equal to I
L
- I
H1
- I
H2
(C). This is shown in the zero sequence network
shown in the following figure:
V00640
I
ROF
= Residual current on faulted feeder
I
ROH
= Residual current on healthy feeder
IOF = IL – IH1 – IH2 – IH3
I
ROF
= I
H3
+ I
OF
so:
I
ROF
= I
L
– I
H1
– I
H2
3X
L
I
L
-V
0
X
CO
IH3 IH2 IH1
Healthy feeders
Faulty feeder
I
ROF
I
ROH
I
ROH
I
OF
Figure 86: Zero sequence network showing residual currents
P543i/P545i Chapter 7 - Distance Protection
P54x1i-TM-EN-1 181
 Loading...