Chapter 5 _______________________________________________________ Plot-Assisted Setups
VAISALA______________________________________________________________________ 145
Sometimes it is useful to run the Pb and Ps commands with samples from
the IF-Input of the IFDR, rather than from the Burst-Input. Similarly, it is
sometimes useful to view the Pr plots on samples of Burst data. Within all
three plotting commands the “%” key can be used to toggle among all five
of the IF input SMA connectors on the IFDR.
5.3 Pb — Plot Burst Pulse Timing
For magnetron radars, the RVP900 relies on samples of the transmit pulse
to lock the phase of its synthesized "I" and "Q" data, and to run the AFC
feedback loop. The Pb command is used to adjust the trigger timing and
A/D sampling window so that the burst pulse is correctly measured.
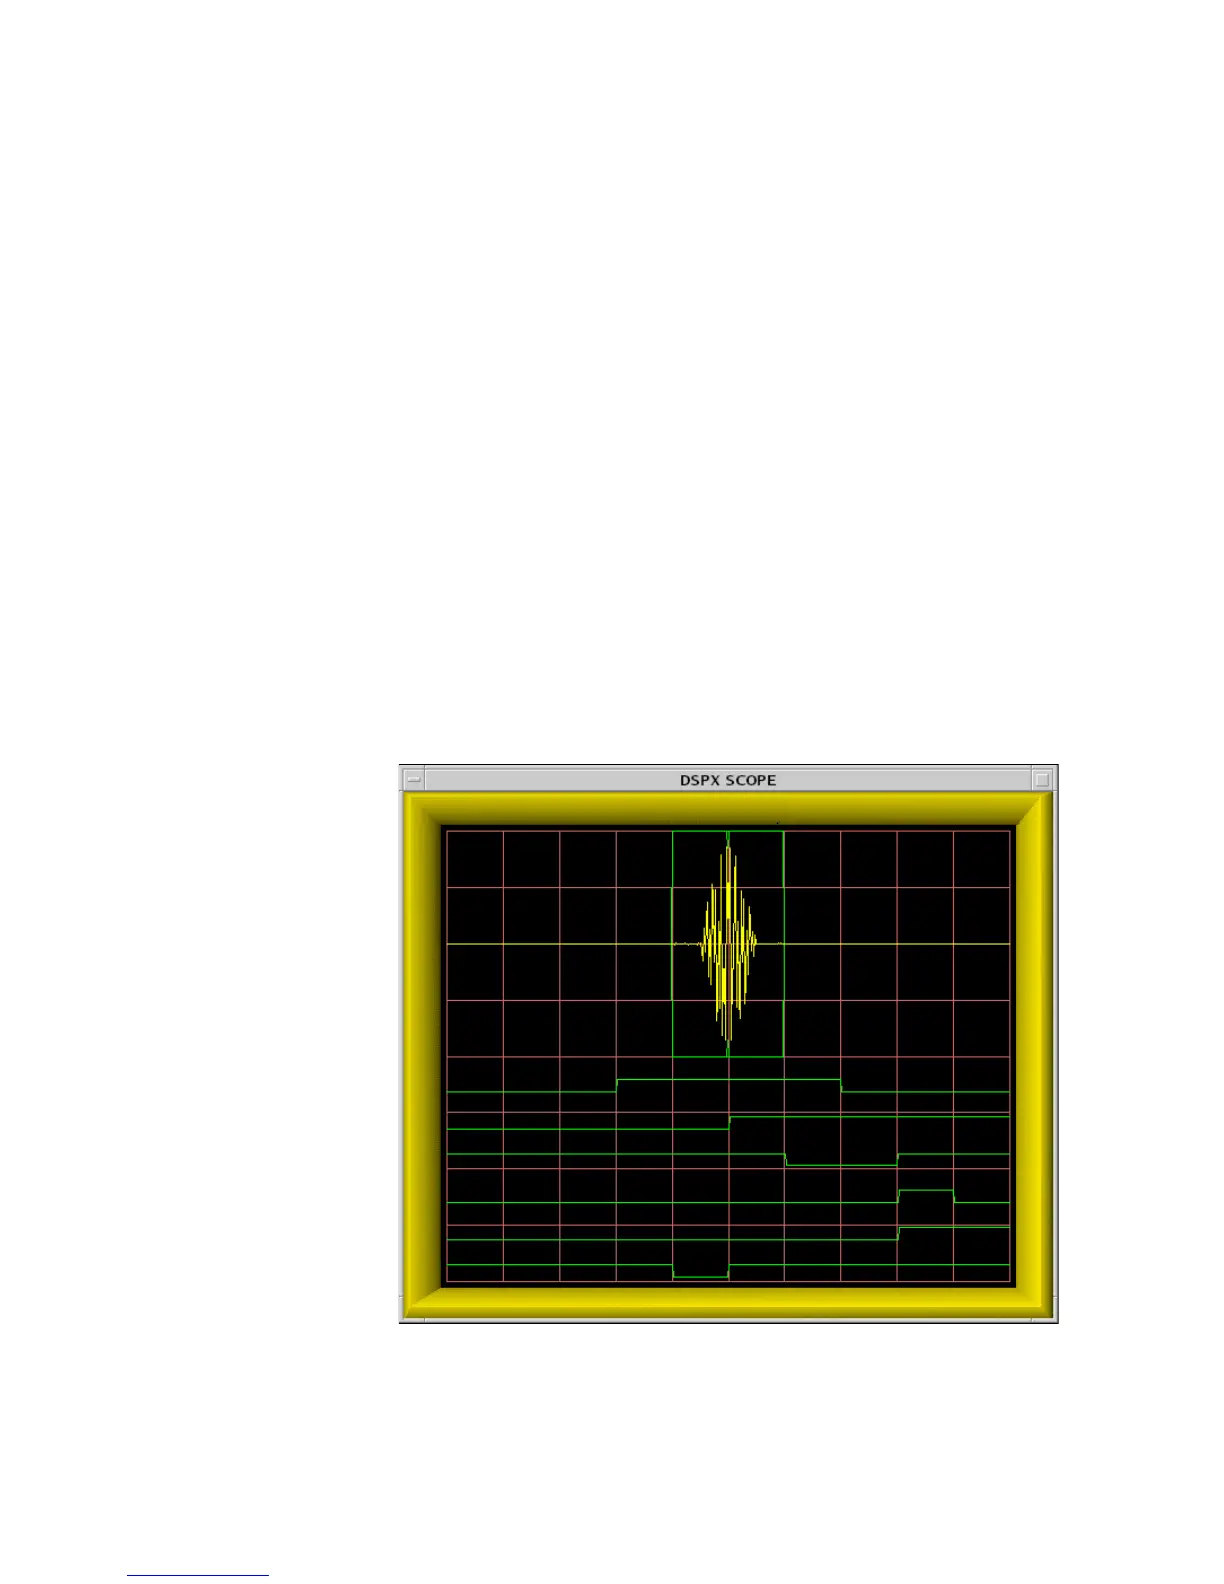
5.3.1 Interpreting the Burst Timing Plot
The display plot ultimately resembles Figure 26 on page 143, which shows
a successful capture of the transmitter's burst pulse. The horizontal axis of
the display represents time, and the overall time span from the left edge to
the right edge is listed as "PlotSpan" on the TTY.
0916-040
Figure 26 Successful Capture of the Transmit Burst
 Loading...