Chapter 5 _______________________________________________________ Plot-Assisted Setups
VAISALA______________________________________________________________________ 165
5.5 Pr — Plot Receiver Waveforms
The Pb and Ps commands described in the previous sections have been
used to analyze the signal that is applied to the "Burst-In" connector of the
IFDR module. The task that remains is to checkout the actual received
signal that is connected to "IF-In". The goal is to verify that the received
signal is clean and appropriately scaled, and that nearby targets can be seen
clearly. The Pr command is used to make these measurements.
5.5.1 Interpreting the Receiver Waveform
Plots
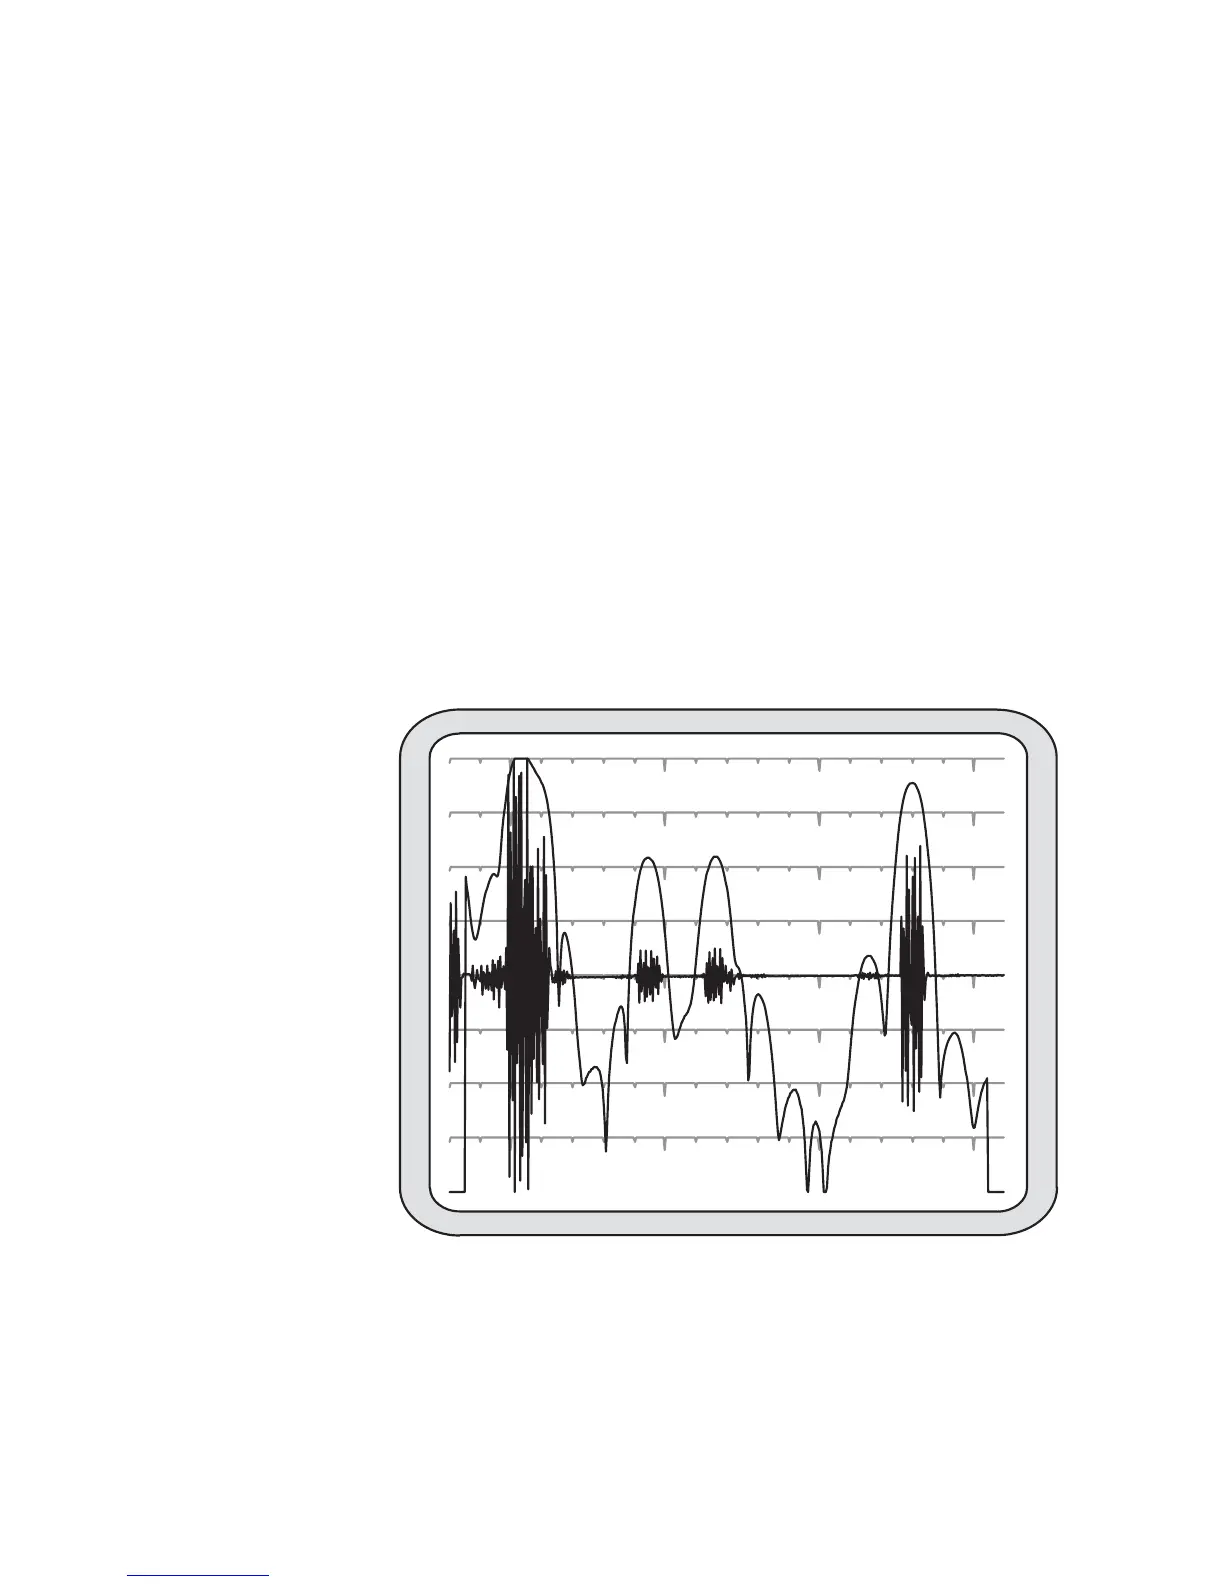
An example of a plot from the Pr command is shown in Figure 30 on page
163. The horizontal axis represents time (range) starting from a selectable
offset and spanning a selectable interval. The data are acquired from a
single transmitted pulse, are plotted both as raw IF samples and as the LOG
of the detected power using the FIR filter for the current pulse width.
0916-044
Figure 30 Example of Combined IF Sample and LOG Plot
6
The IF samples are plotted on a linear scale as signed quantities, with zero
appearing at the center line of the scope. Any DC offset that may be present
in the A/D converter is not removed, and will be seen as a shift in the
 Loading...