USER’S MANUAL__________________________________________________________________
162 _________________________________________________________________ M211322EN-D
5.4.5 Recommended Adjustment
Procedures
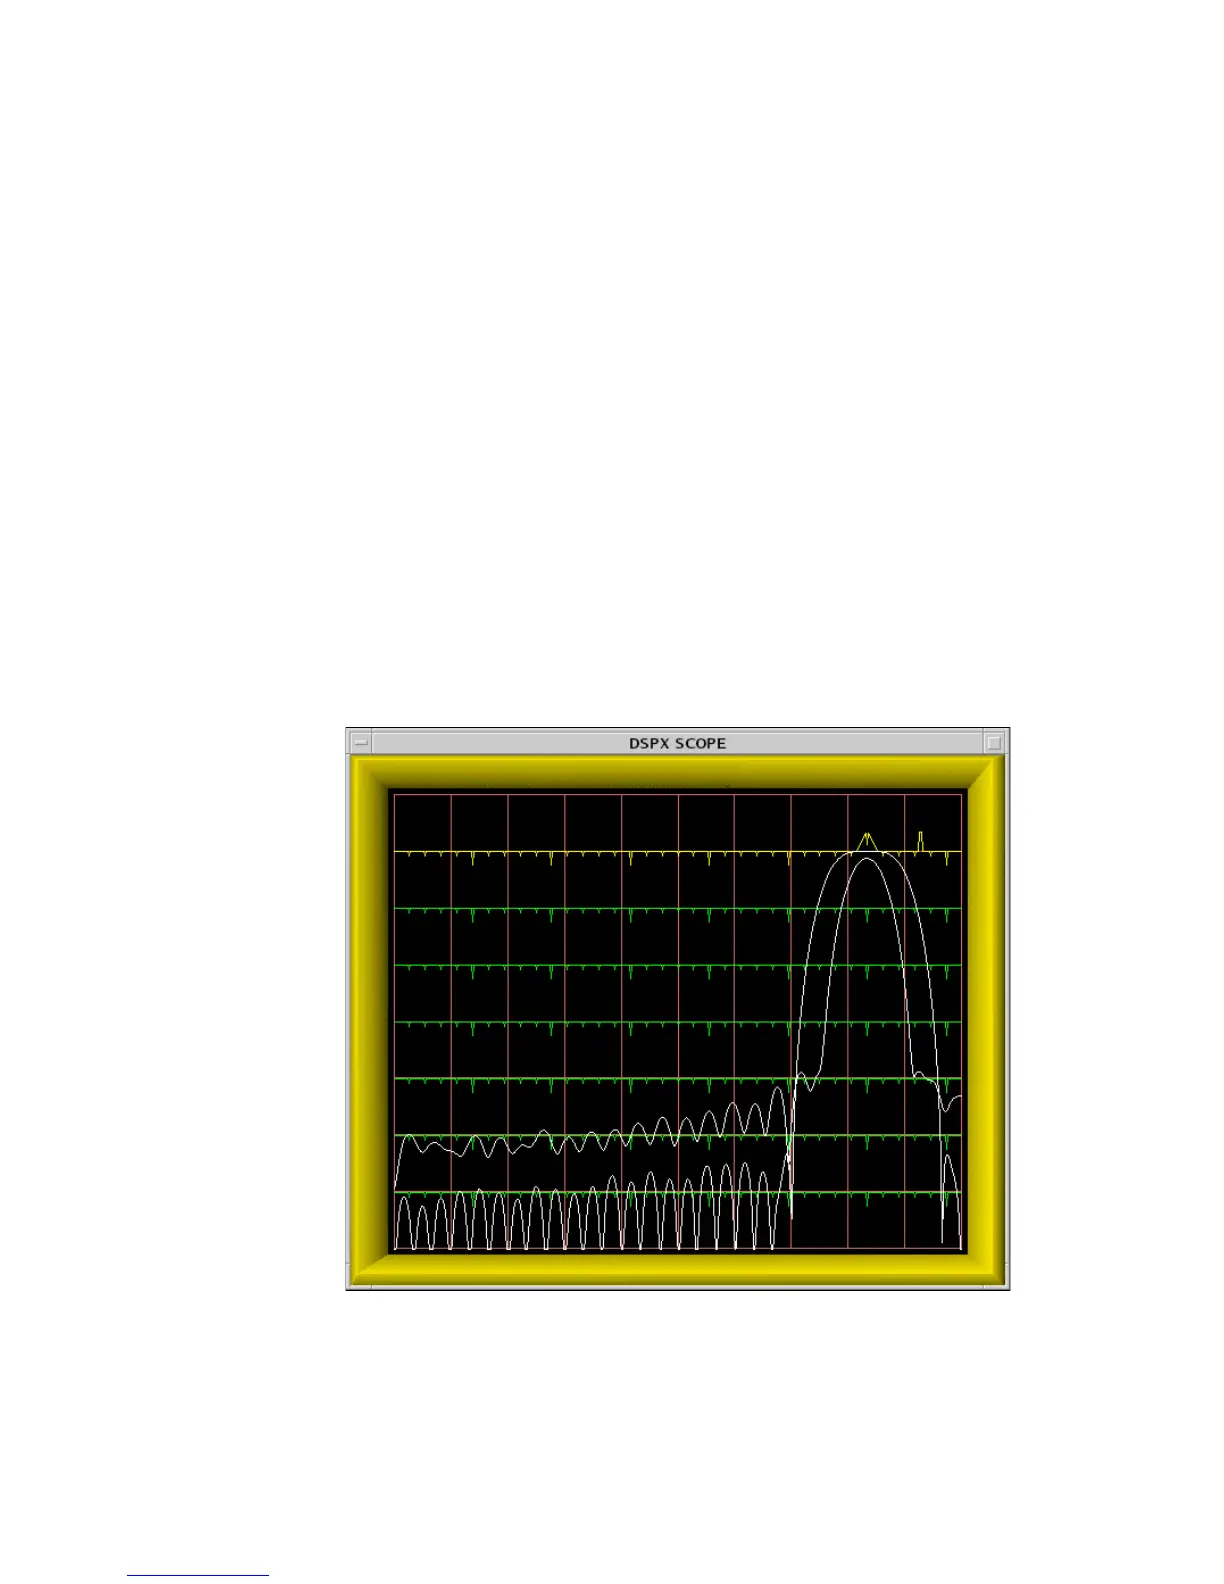
The Ps command should be used only after the burst pulse has been
successfully captured by way of the Pb command. Use the <space> key to
display the burst spectrum plot by itself, and use the Z key to shift the entire
graph into view. You are now looking at the actual frequency content of
the transmitted pulse. The plot should show a clean main power lobe
centered at the receivers intermediate frequency. Check the spectrum for
spurious harmonics, excessive width, and other out-of-band noise. Make
any adjustments in the transmitter that might give a sharper main lobe or
reduced spurious noise.
Once we know the power spectrum of the transmitted pulse we can begin
designing the matched FIR filter. Use the <space> key to display both the
filter response and the burst spectrum on the same plot. Use the Z key to
shift the bursts main lobe up to the top horizontal line of the graph. This
makes it level with the filters peak lobe, which is always drawn tangent to
the same top line.
0916-042
Figure 28 Example of a Poorly Matched Filter
 Loading...