Chapter 5 _______________________________________________________ Plot-Assisted Setups
VAISALA______________________________________________________________________ 171
5.6.1 Interpreting the Ambiguity Plots
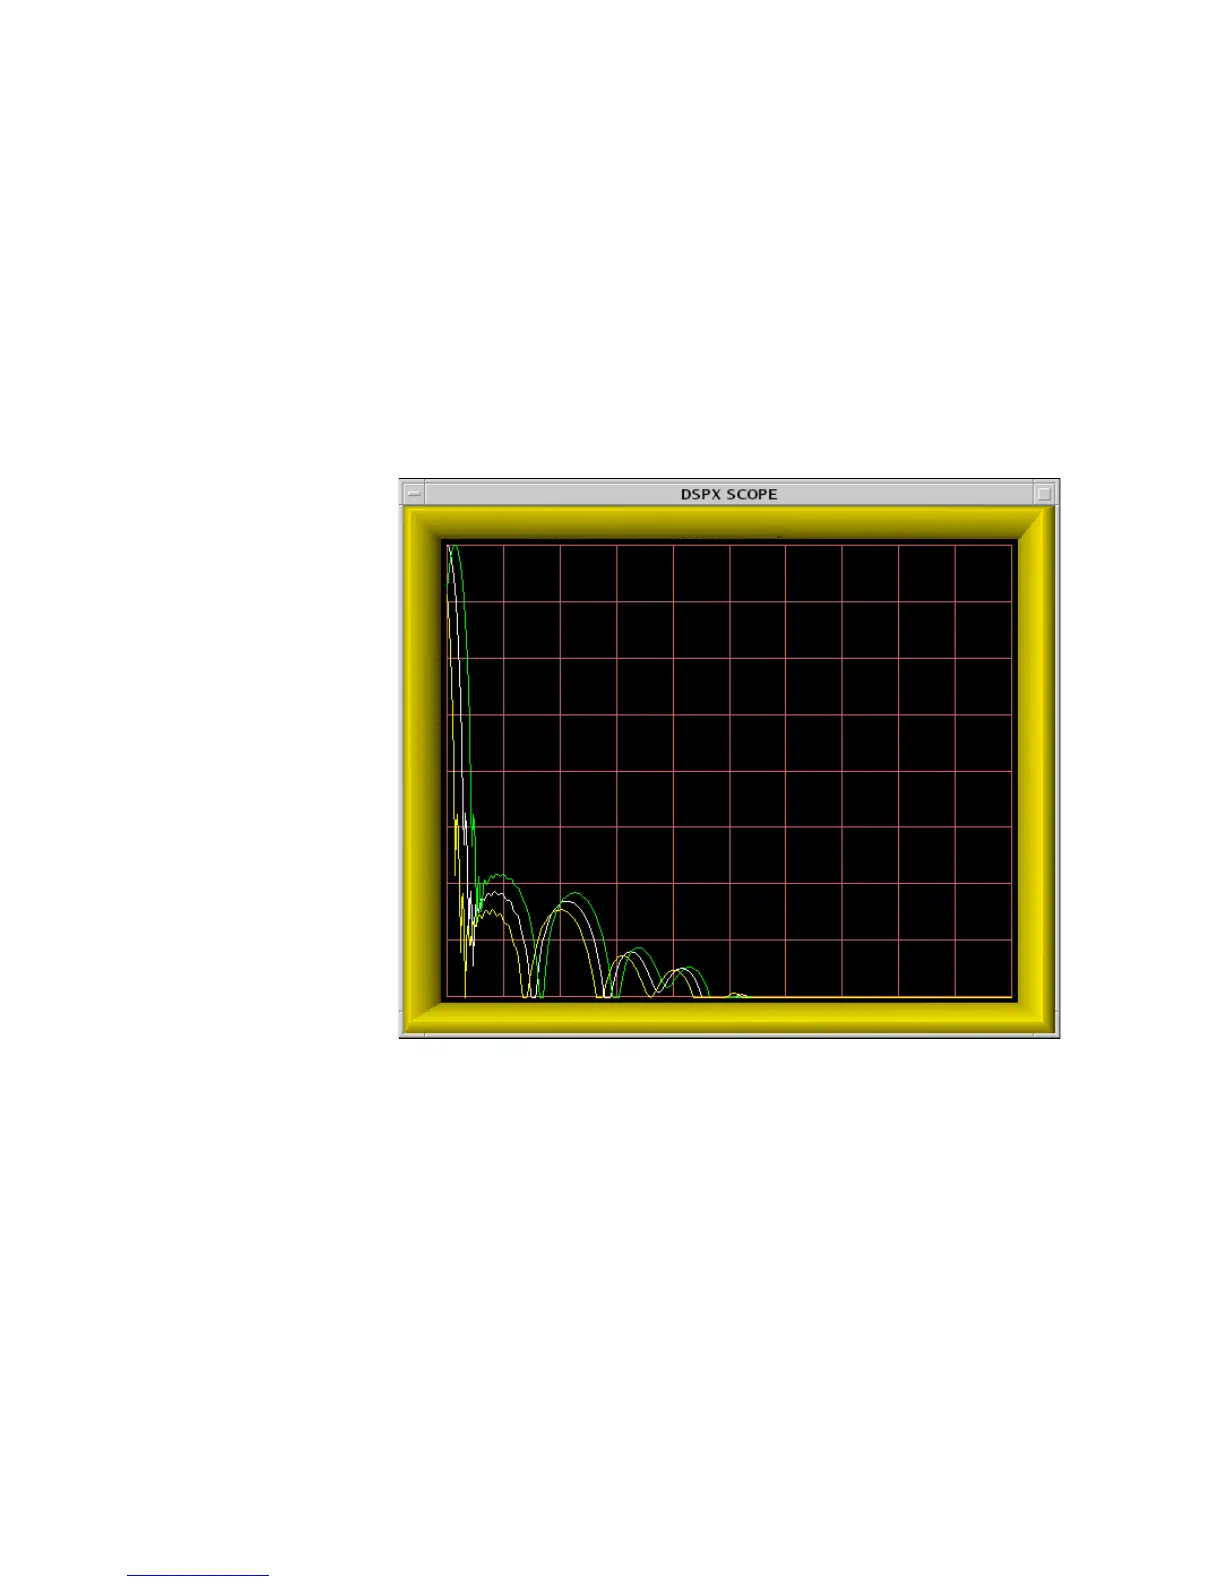
Figure 32 on page 169 shows one form of Pa plot in which the magnitude
of the Tx/Rx range sidelobes are drawn on a log scale having 10dB vertical
ticks. The horizontal span of the plot is equal to the length of the pulse, and
consequently, only half of the complete ambiguity diagram is shown. This
was done to make the plots more viewable; and no information lost since
the zero-Doppler response (white plot) can safely be assumed to be
symmetric. In this example the pulse width is 30 μsec, bandwidth is
3 MHz, PSL is -61.2 dB and ISL is -50.8 dB, Doppler shift ± 50 KHz.
0916-046
Figure 32 Ambiguity Diagram of a Compressed Tx Pulse
Also shown in yellow and green are the Tx/Rx responses when the overall
waveform is modified by a 50 KHz target Doppler shift. Real weather
targets would never have such a large Doppler component, but the Pa
menu allows you to study its effect anyway.
An alternate form of Pa plot of the same Tx waveform is shown in Figure
33 on page 170. The horizontal axis again represents time, but now spans
the entire duration of the pulse. Three different plots are drawn, hence the
vertical axis is interpreted differently in each case:
 Loading...